Oh, here is more
Webinar: How to 10x Development Speed when Building an ADAS HMI Towards Production
Surround Reality (SR) is rapidly gaining traction because it provides the situational awareness toda...
Watch Video
Webinar: Safe, Smart, Seamless: Navigating HMI Hurdles in Lab Equipment
This webinar is part of a two-part series that explores how medical Human–Machine Interfaces (HMIs) ...
Watch Video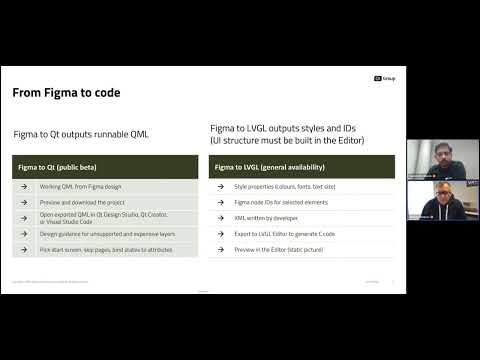
Webinar: Qt for MCUs vs. LVGL: A Comparative Study from Design to Deployment
Listen to Qt Group and Spyrosoft for a practical comparison of Qt for MCUs vs. LVGL. See real-world ...
Watch Video
Webinar: Leading into 2026: Insights for the Software-Defined Vehicle era
The software-defined vehicle (SDV) era isn’t coming, it’s already here. But this shift is creating a...
Watch Video