What is Qt Insight 1.0?
March 28, 2023 by Tapio Haantie | Comments
Qt Insight is a product analytics solution providing real-world data into how people use a software application or a digital device. The first version of Qt Insight for General Availability was released in March 2023. Qt Insight consists of three major components: The Qt Tracker software library embedded in the Qt application, the Qt Insight Cloud Services, and the Qt Insight Console for analyzing behavioral data in a web browser.
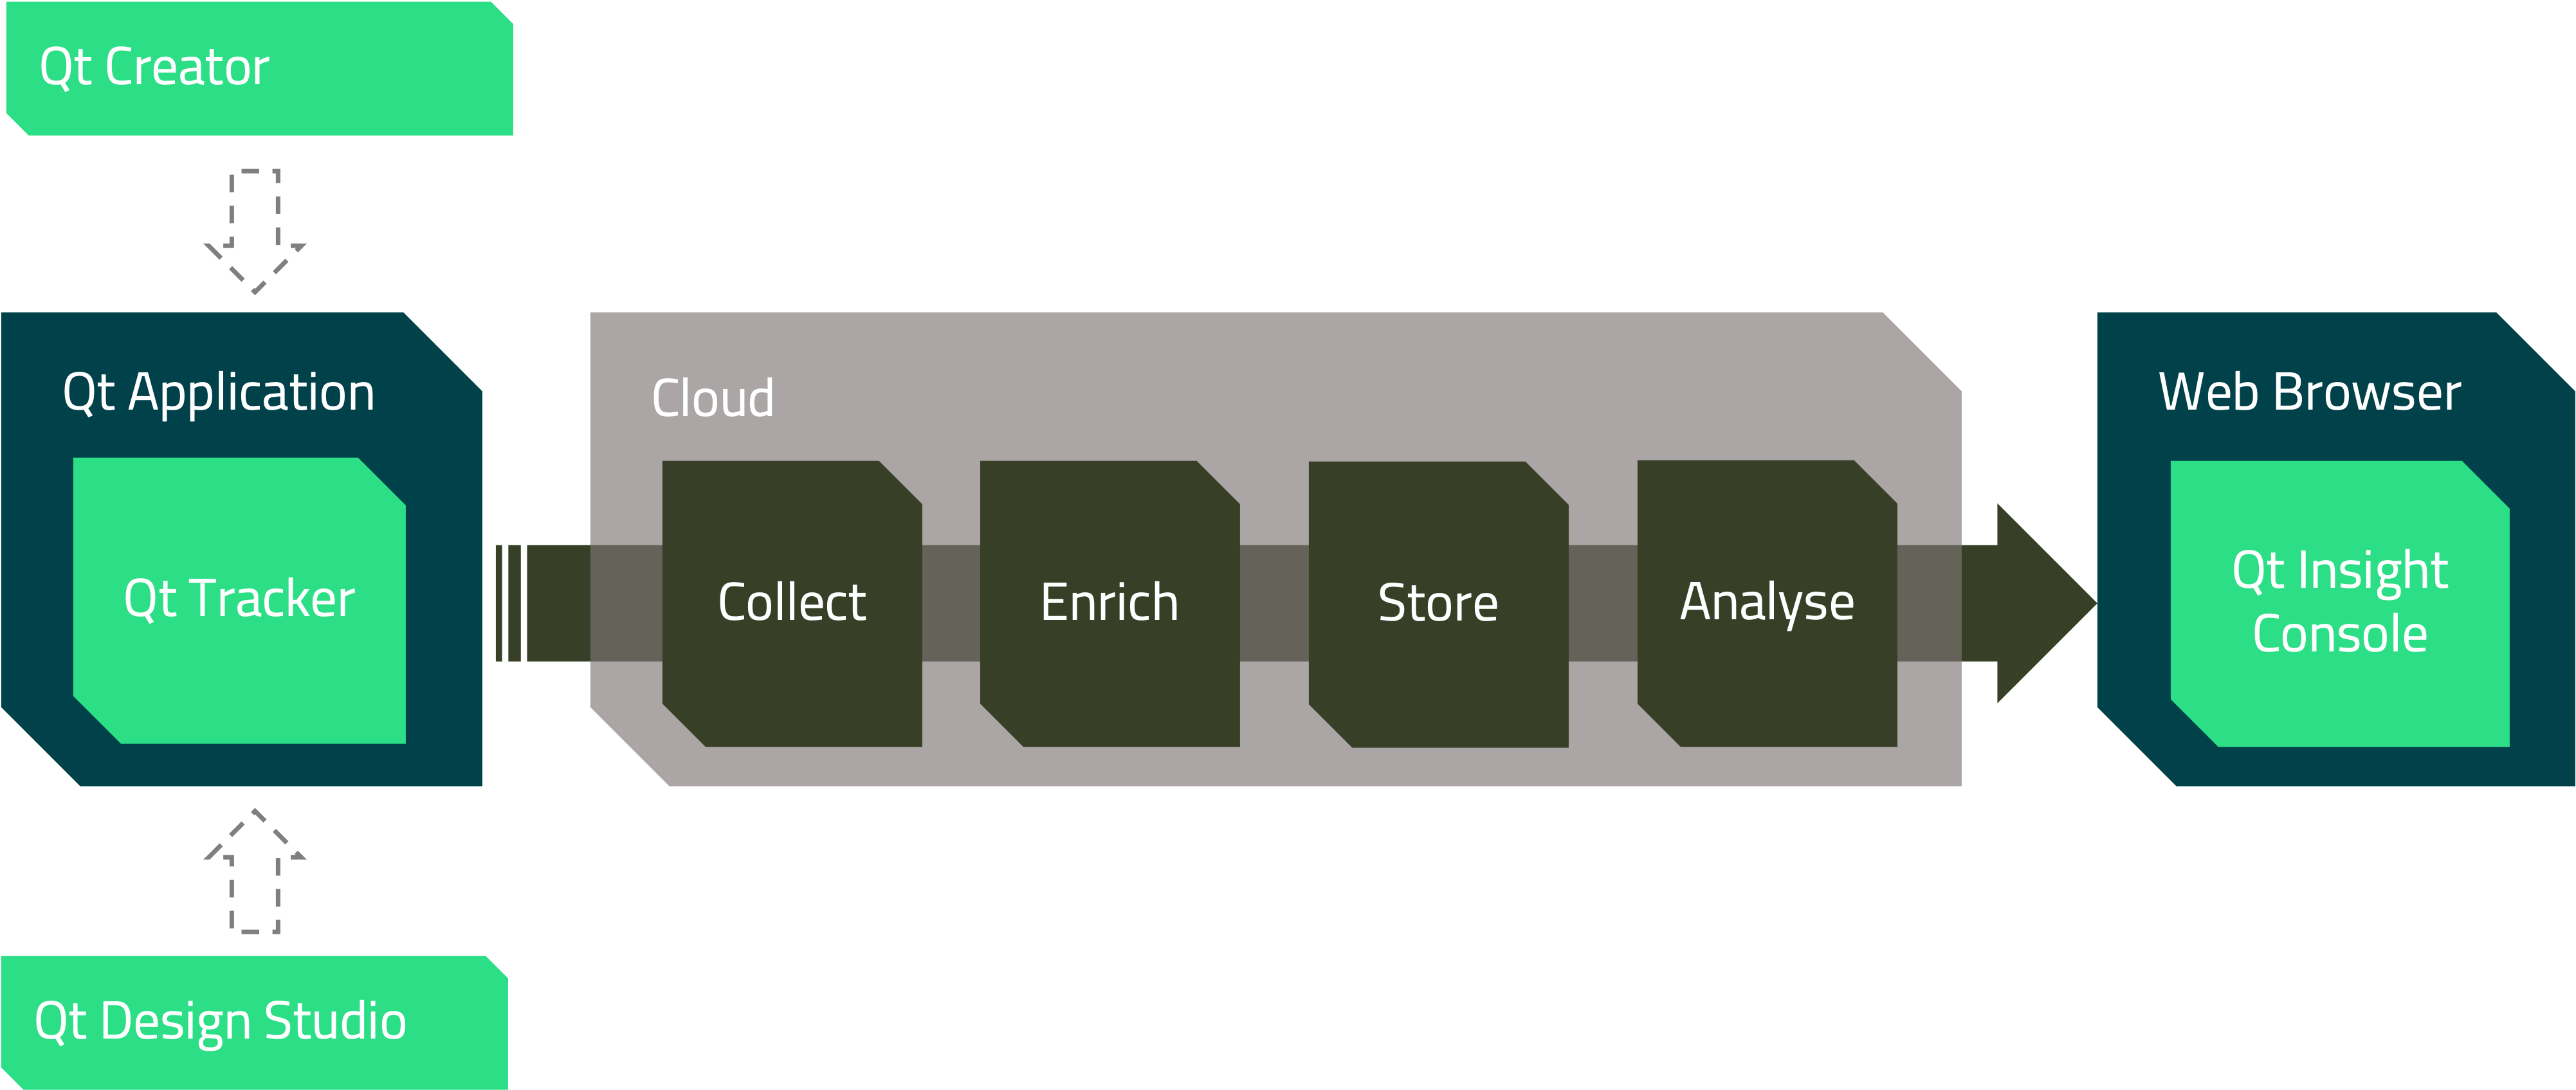
Qt Insight complements traditional end user research methods, which range from online surveys over end-user interviews to focus groups. Conventional qualitative research methods are commonly only applied during early product development. Qt Insight closes the gap between UX research in the early stages of development and product lifecycle management.
The solution allows Product Managers, UX Designers, Marketers, and Software Developers to manage the customer experience based on actual data from true daily use from a large sample of connected devices. With it, Product Managers can become aware of customer pain points, analyze performance, and create tangible, evidence-based development plans for their business.
Qt Insight Console
The Qt Insight Console application serves as a tool to visualize, compare, and filter information. The Qt Insight Console web application runs on the latest version of all common web browsers, including Google's Chrome, Mozilla's Firefox, Microsoft Edge, and Apple's Safari.
Access to the Qt Insight Console is provided through the user’s Qt Account, the user’s personal registration for any software license and service provided by the Qt Company.
Dashboard
The Dashboard is the main place for Product Managers to do feature adoption analytics. Feature adoption analysis with 24/7 tracking of the actual usage of a digital product opens an entirely new perspective into what customers use, when, and how often. It gives Product Managers an idea of which capabilities end users embrace and which they ignore. Using a feature only once a year (or even less) is okay if that's the target. Whether or not the frequency of product usage meets your design expectation is what matters. Features that should deliver a lot of value but find little adoption in everyday life are such that they deserve the attention of Product Managers.
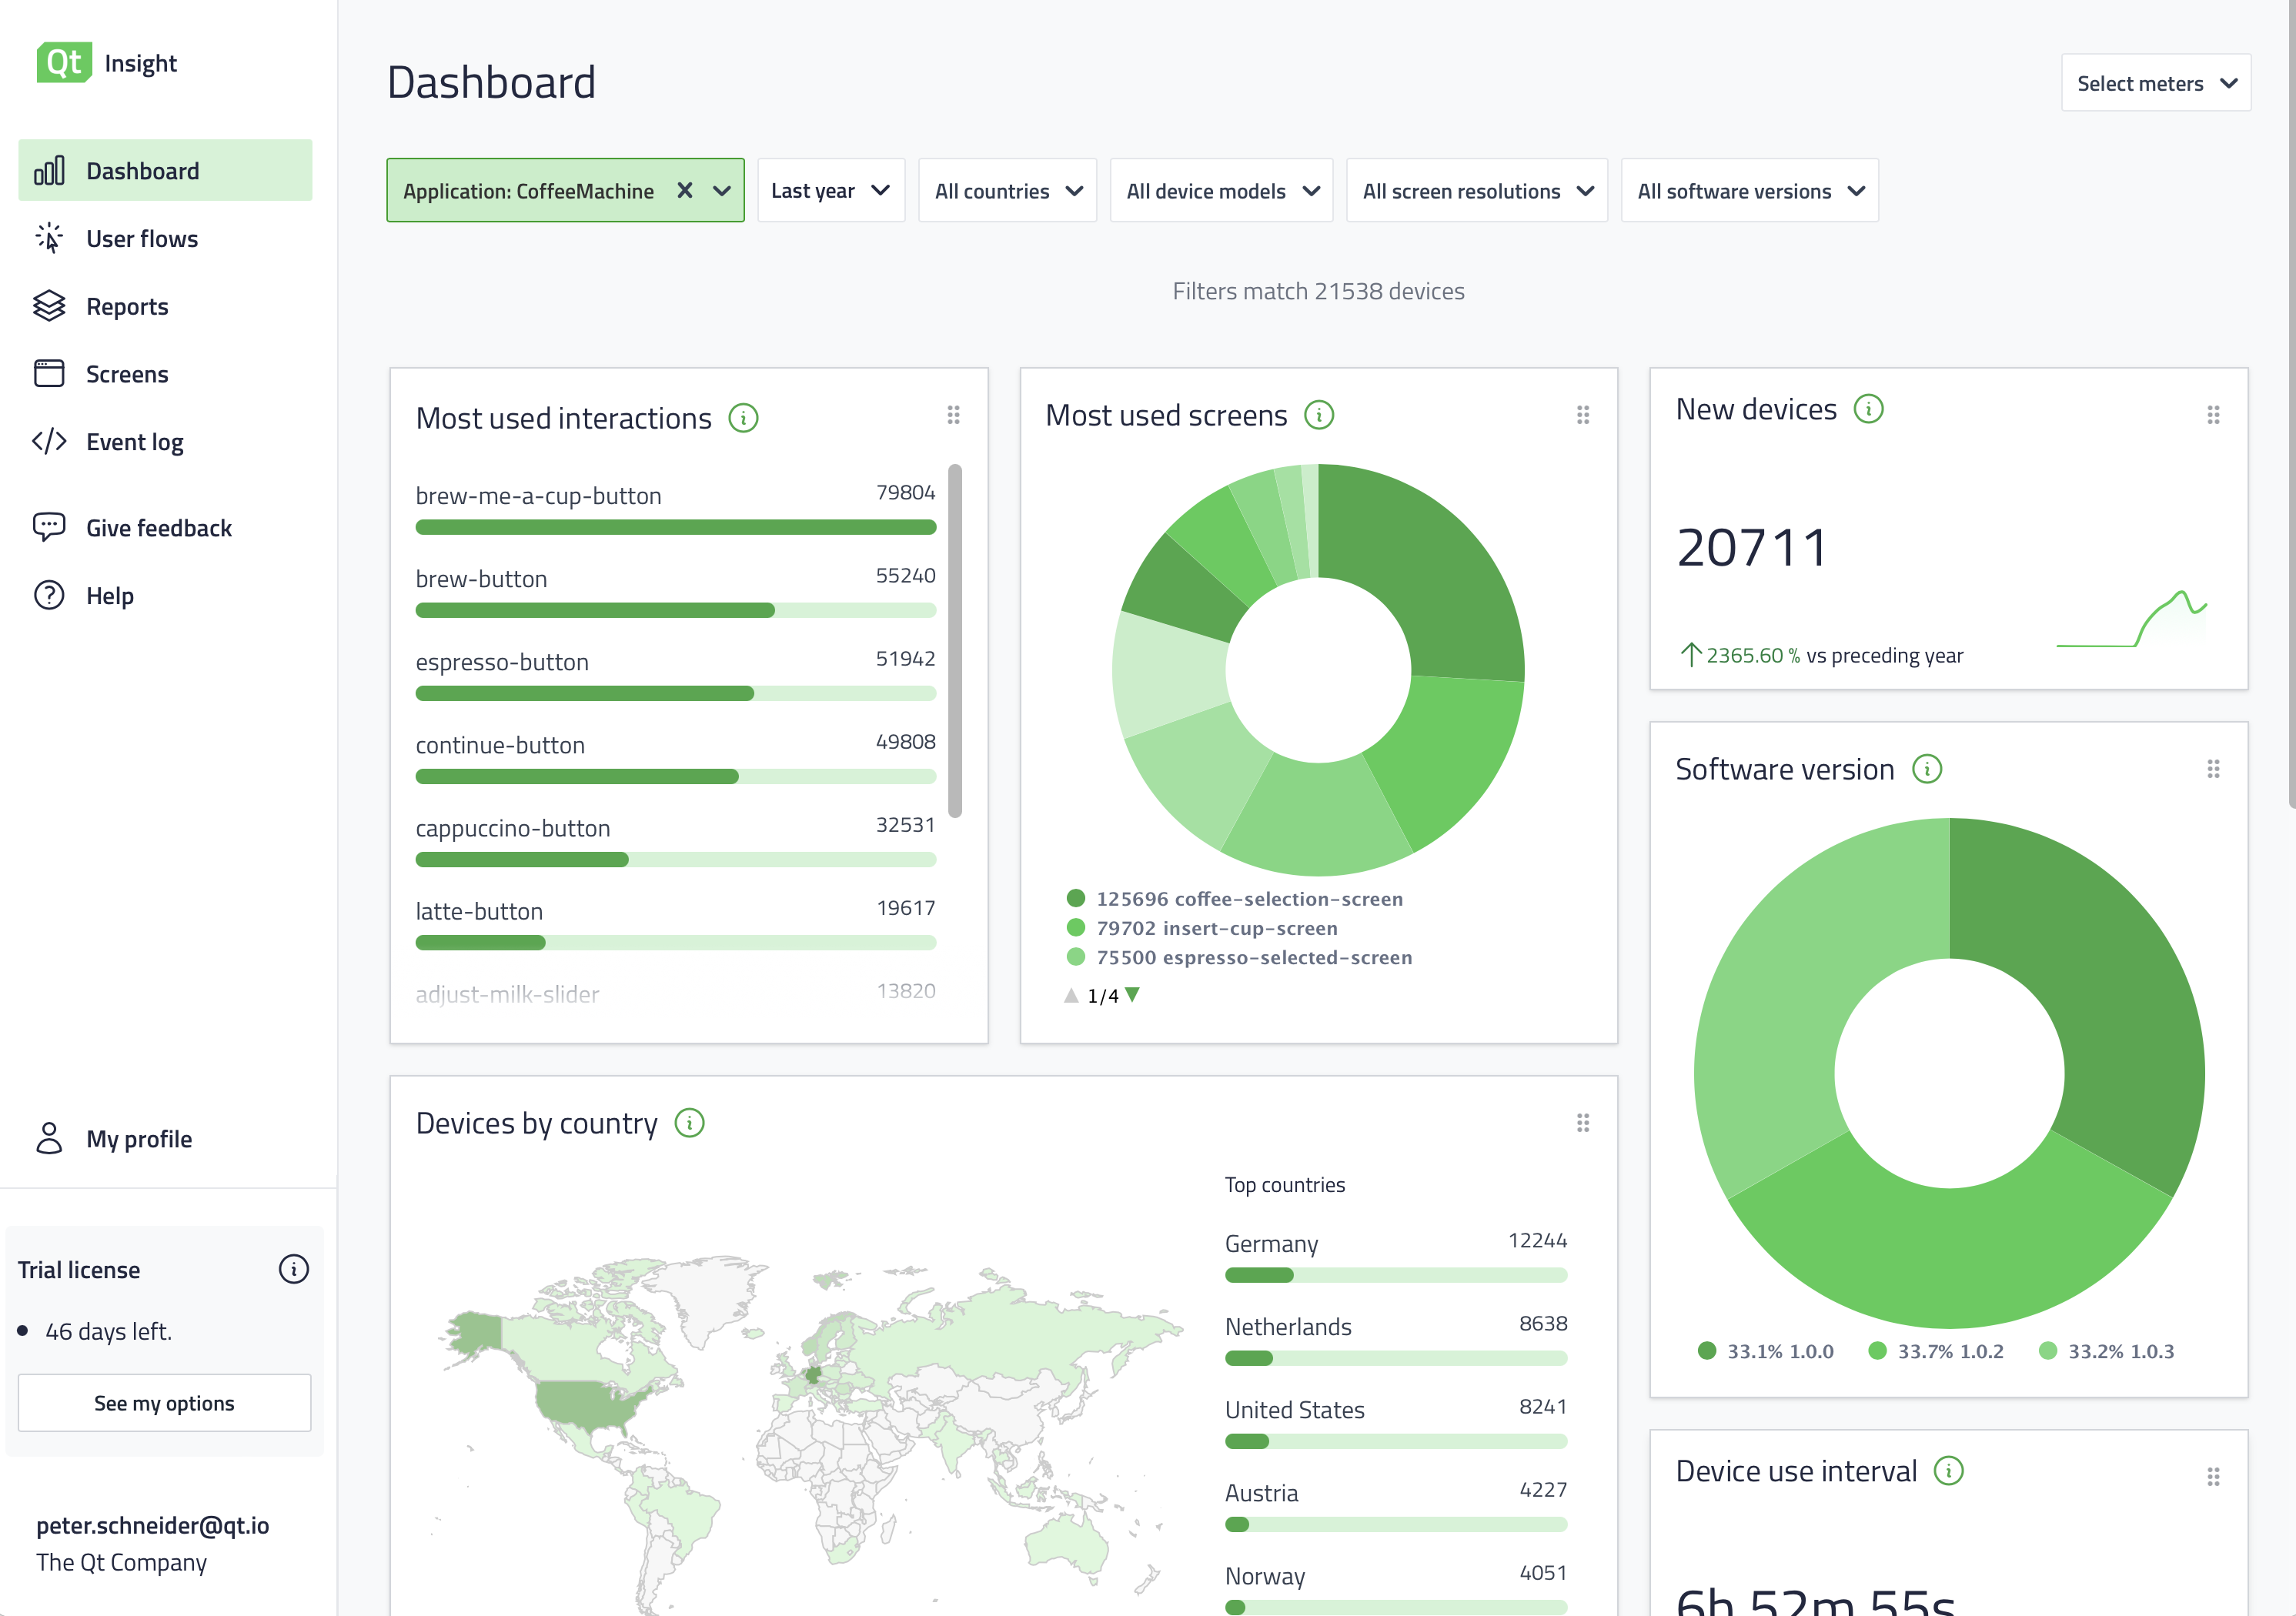
Feature adoption analysis records an event for every user interaction on UI elements marked as relevant to be studied. The Dashboard is the central place to visualize the event data in meaningful charts. Each user has one dashboard and can customize which reports are shown in which place. The location of the charts can be changed through drag & drop action on a virtual grid.
Furthermore, users can apply filters such as application, device model, software version, or time frame to focus on which data is displayed in the Dashboard. Multiple filters can be applied at the same time.
Users can select which of the following pre-configured reports are shown on the Dashboard:
• Most used interactions
• Most used screens
• Average session length
• Device use interval
• Device consecutive use
• Number of new devices
• Number of total devices in use
• Software versions
• Top times of use (weekday/hour)
• Devices by country
• Shutdown success rate
User Flows View
UX Researchers and Product Managers can optimize the customer experience based on true, near-real-time data at any stage of the lifecycle.
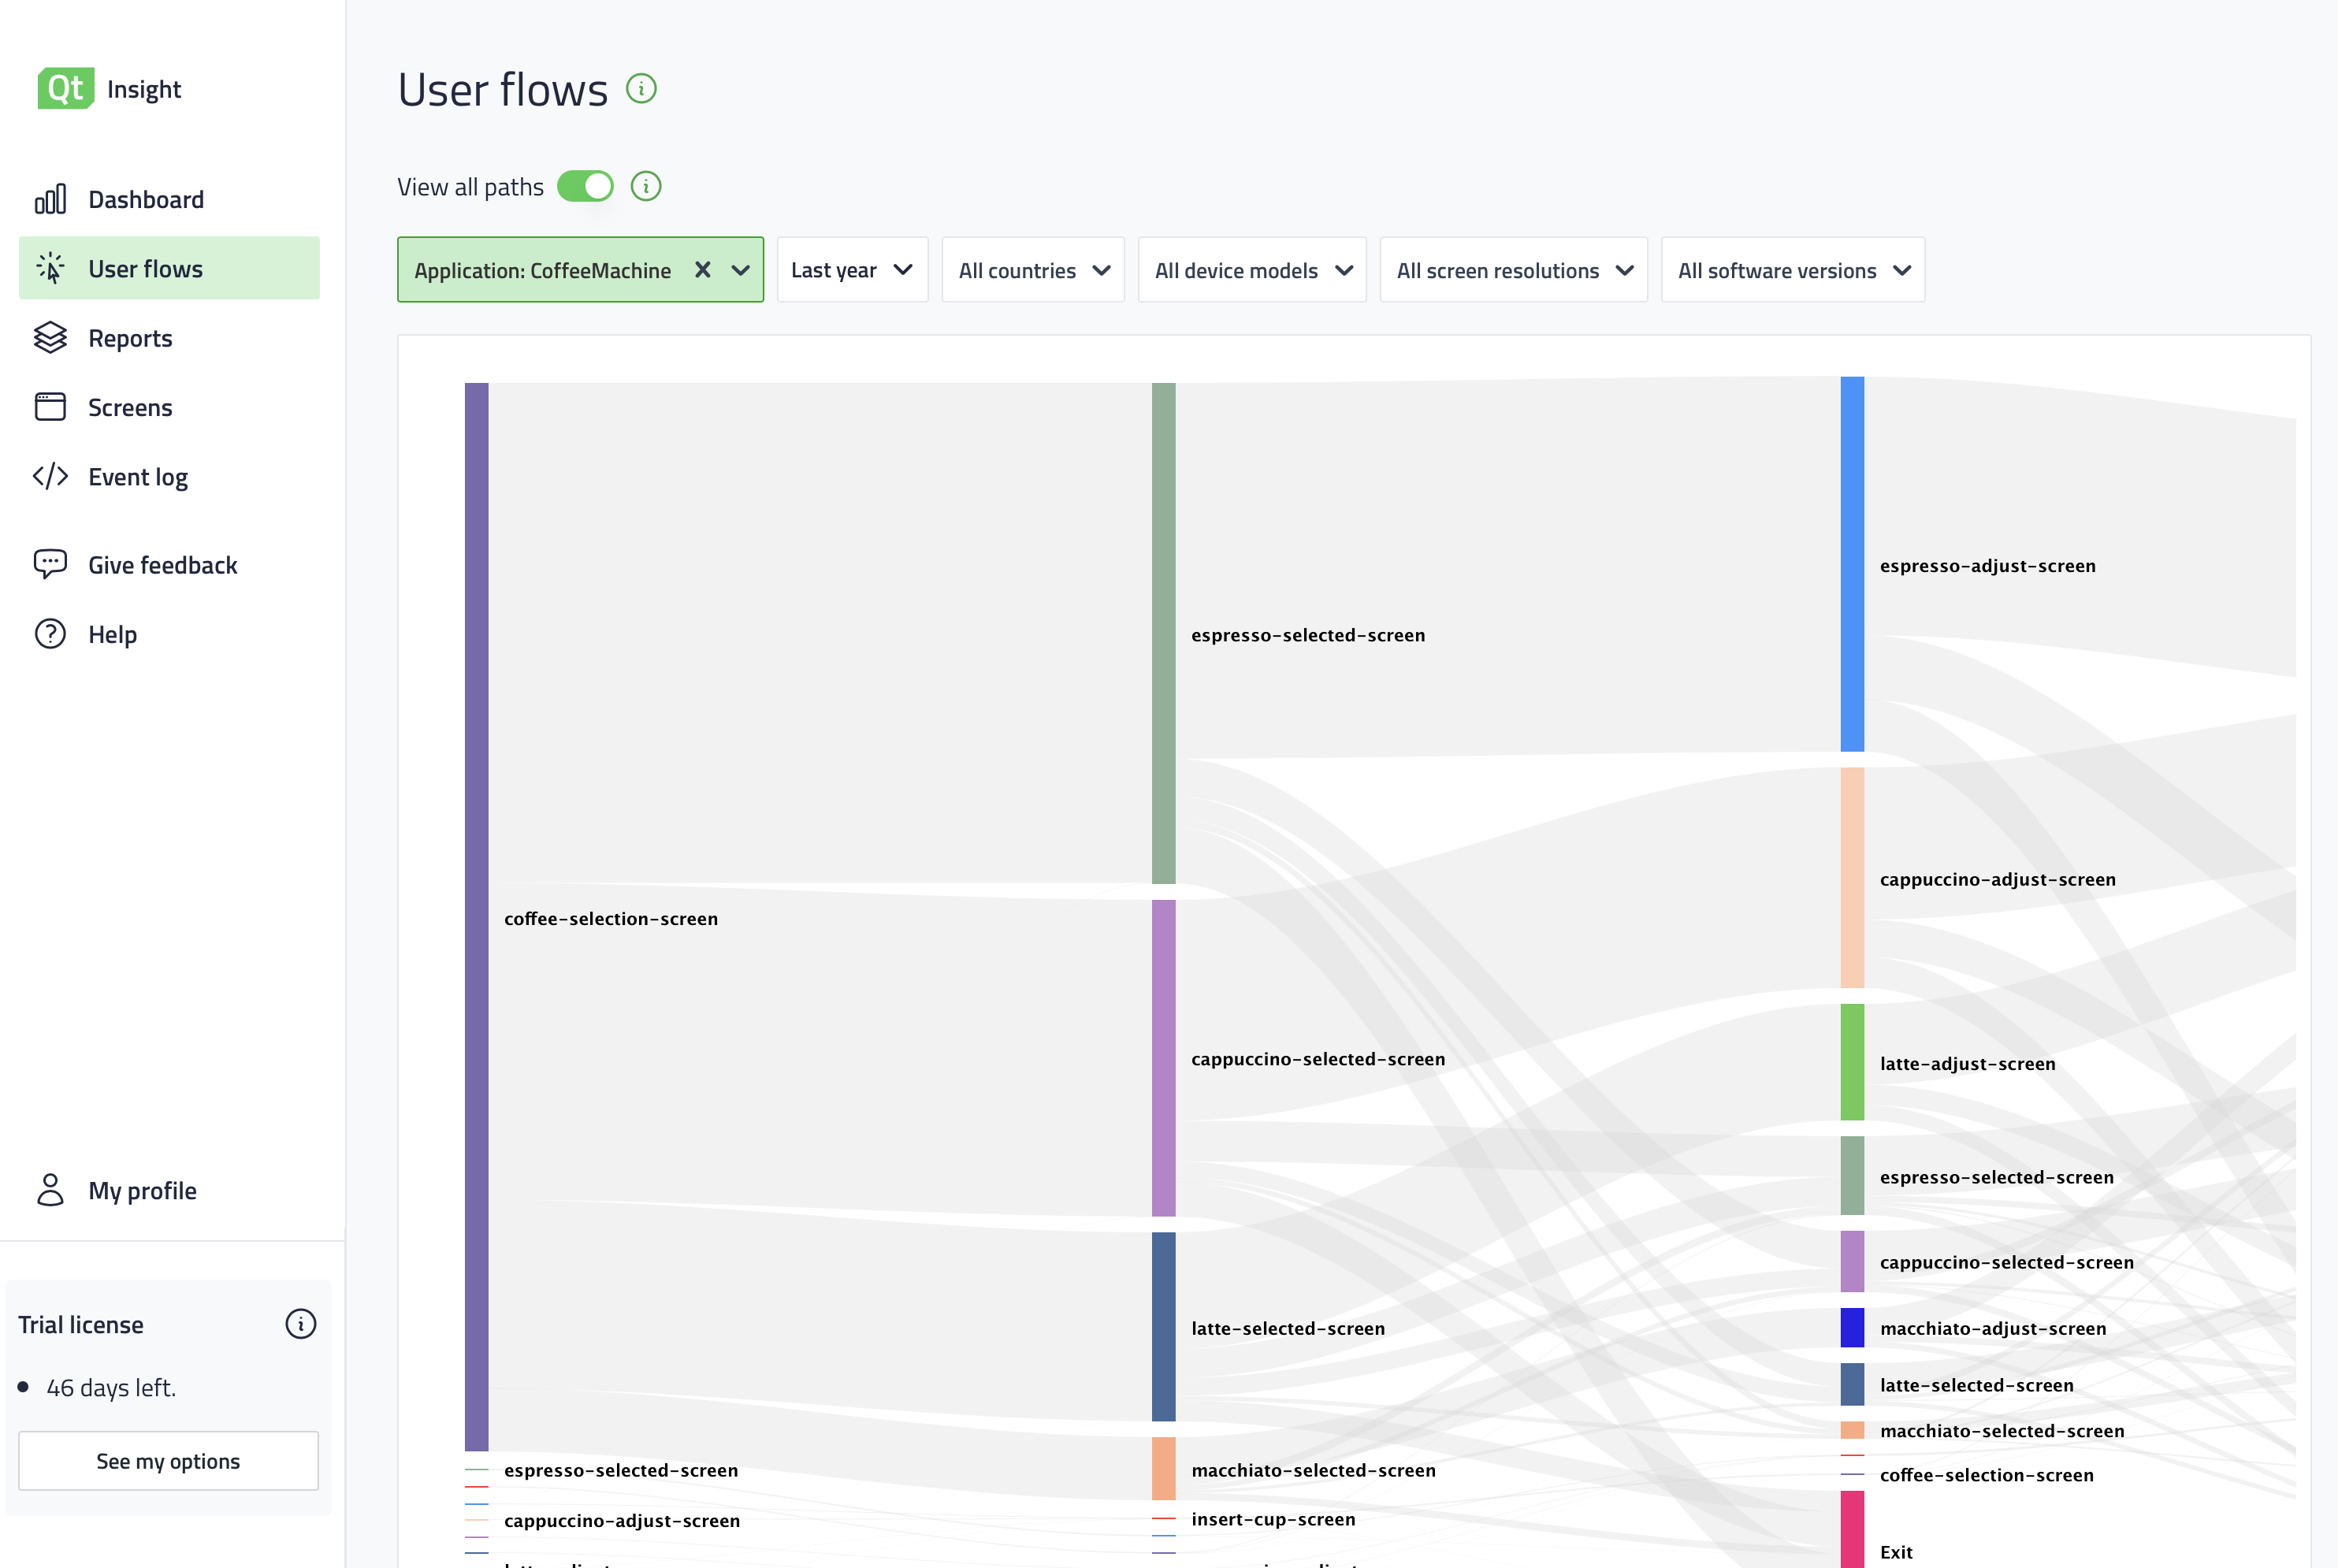
Qt Insight allows UX and UI designers to analyze the UI navigation during the daily life of customers and from a large sample. Qt Insight visualizes which UI paths end users frequently choose and which navigation methods do not find high adoption. The User Flows view illustrates the UI paths people navigate from the first UI screen (typically the home screen of the application) until they exit it.
Reports View
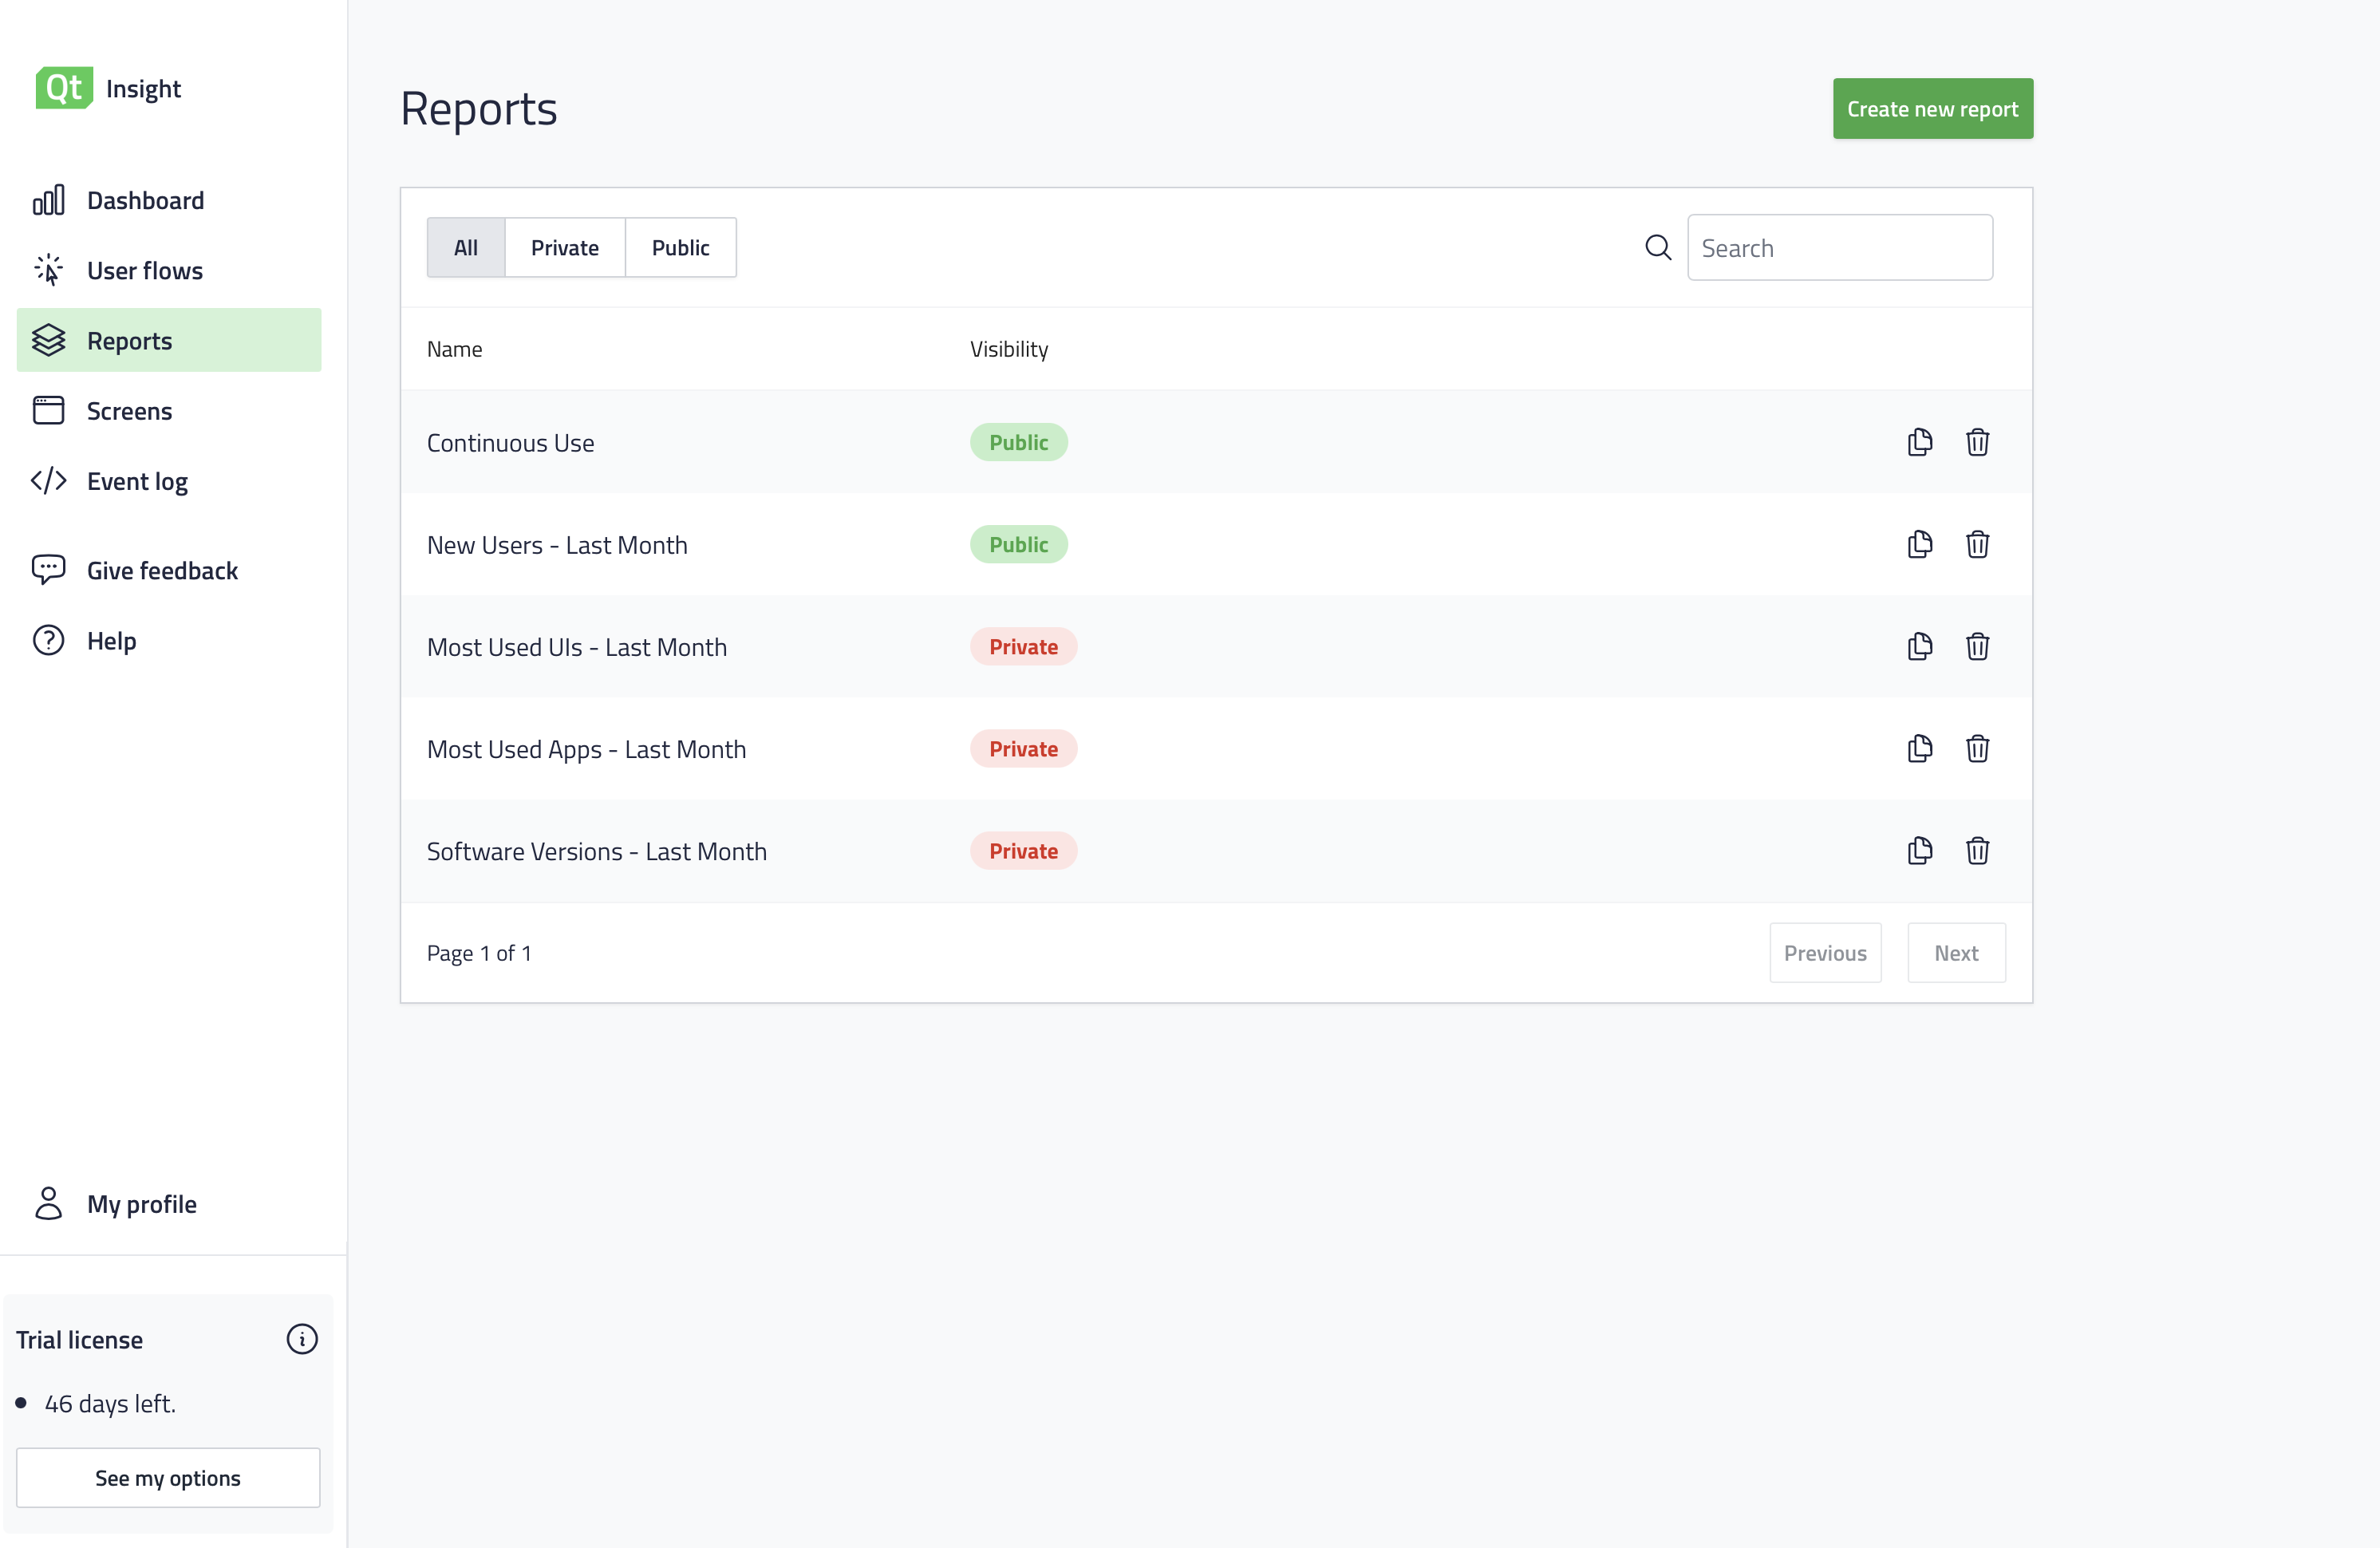
Users can create customized reports and share them with others in the same organization in the Reports view of the Qt Insight Console.
A new report will be created as a private report and can be published to the organization using the "Publish" button. The Reports view may also contain public reports others have shared in your organization.
Furthermore, users can compare the results of one report with another by creating side-by-side comparisons and using the available filters. Comparison reports can help with optimizing product capabilities. UI Designers or Product Managers can test which implementation option, for example, the placement of text or interaction, is ideal for optimizing the experience. This can be done by distributing and comparing two software versions with different implementation alternatives.
Screens View
The Screens view shows the detailed usage information of individual UI screens enabling a more detailed User Experience analysis.
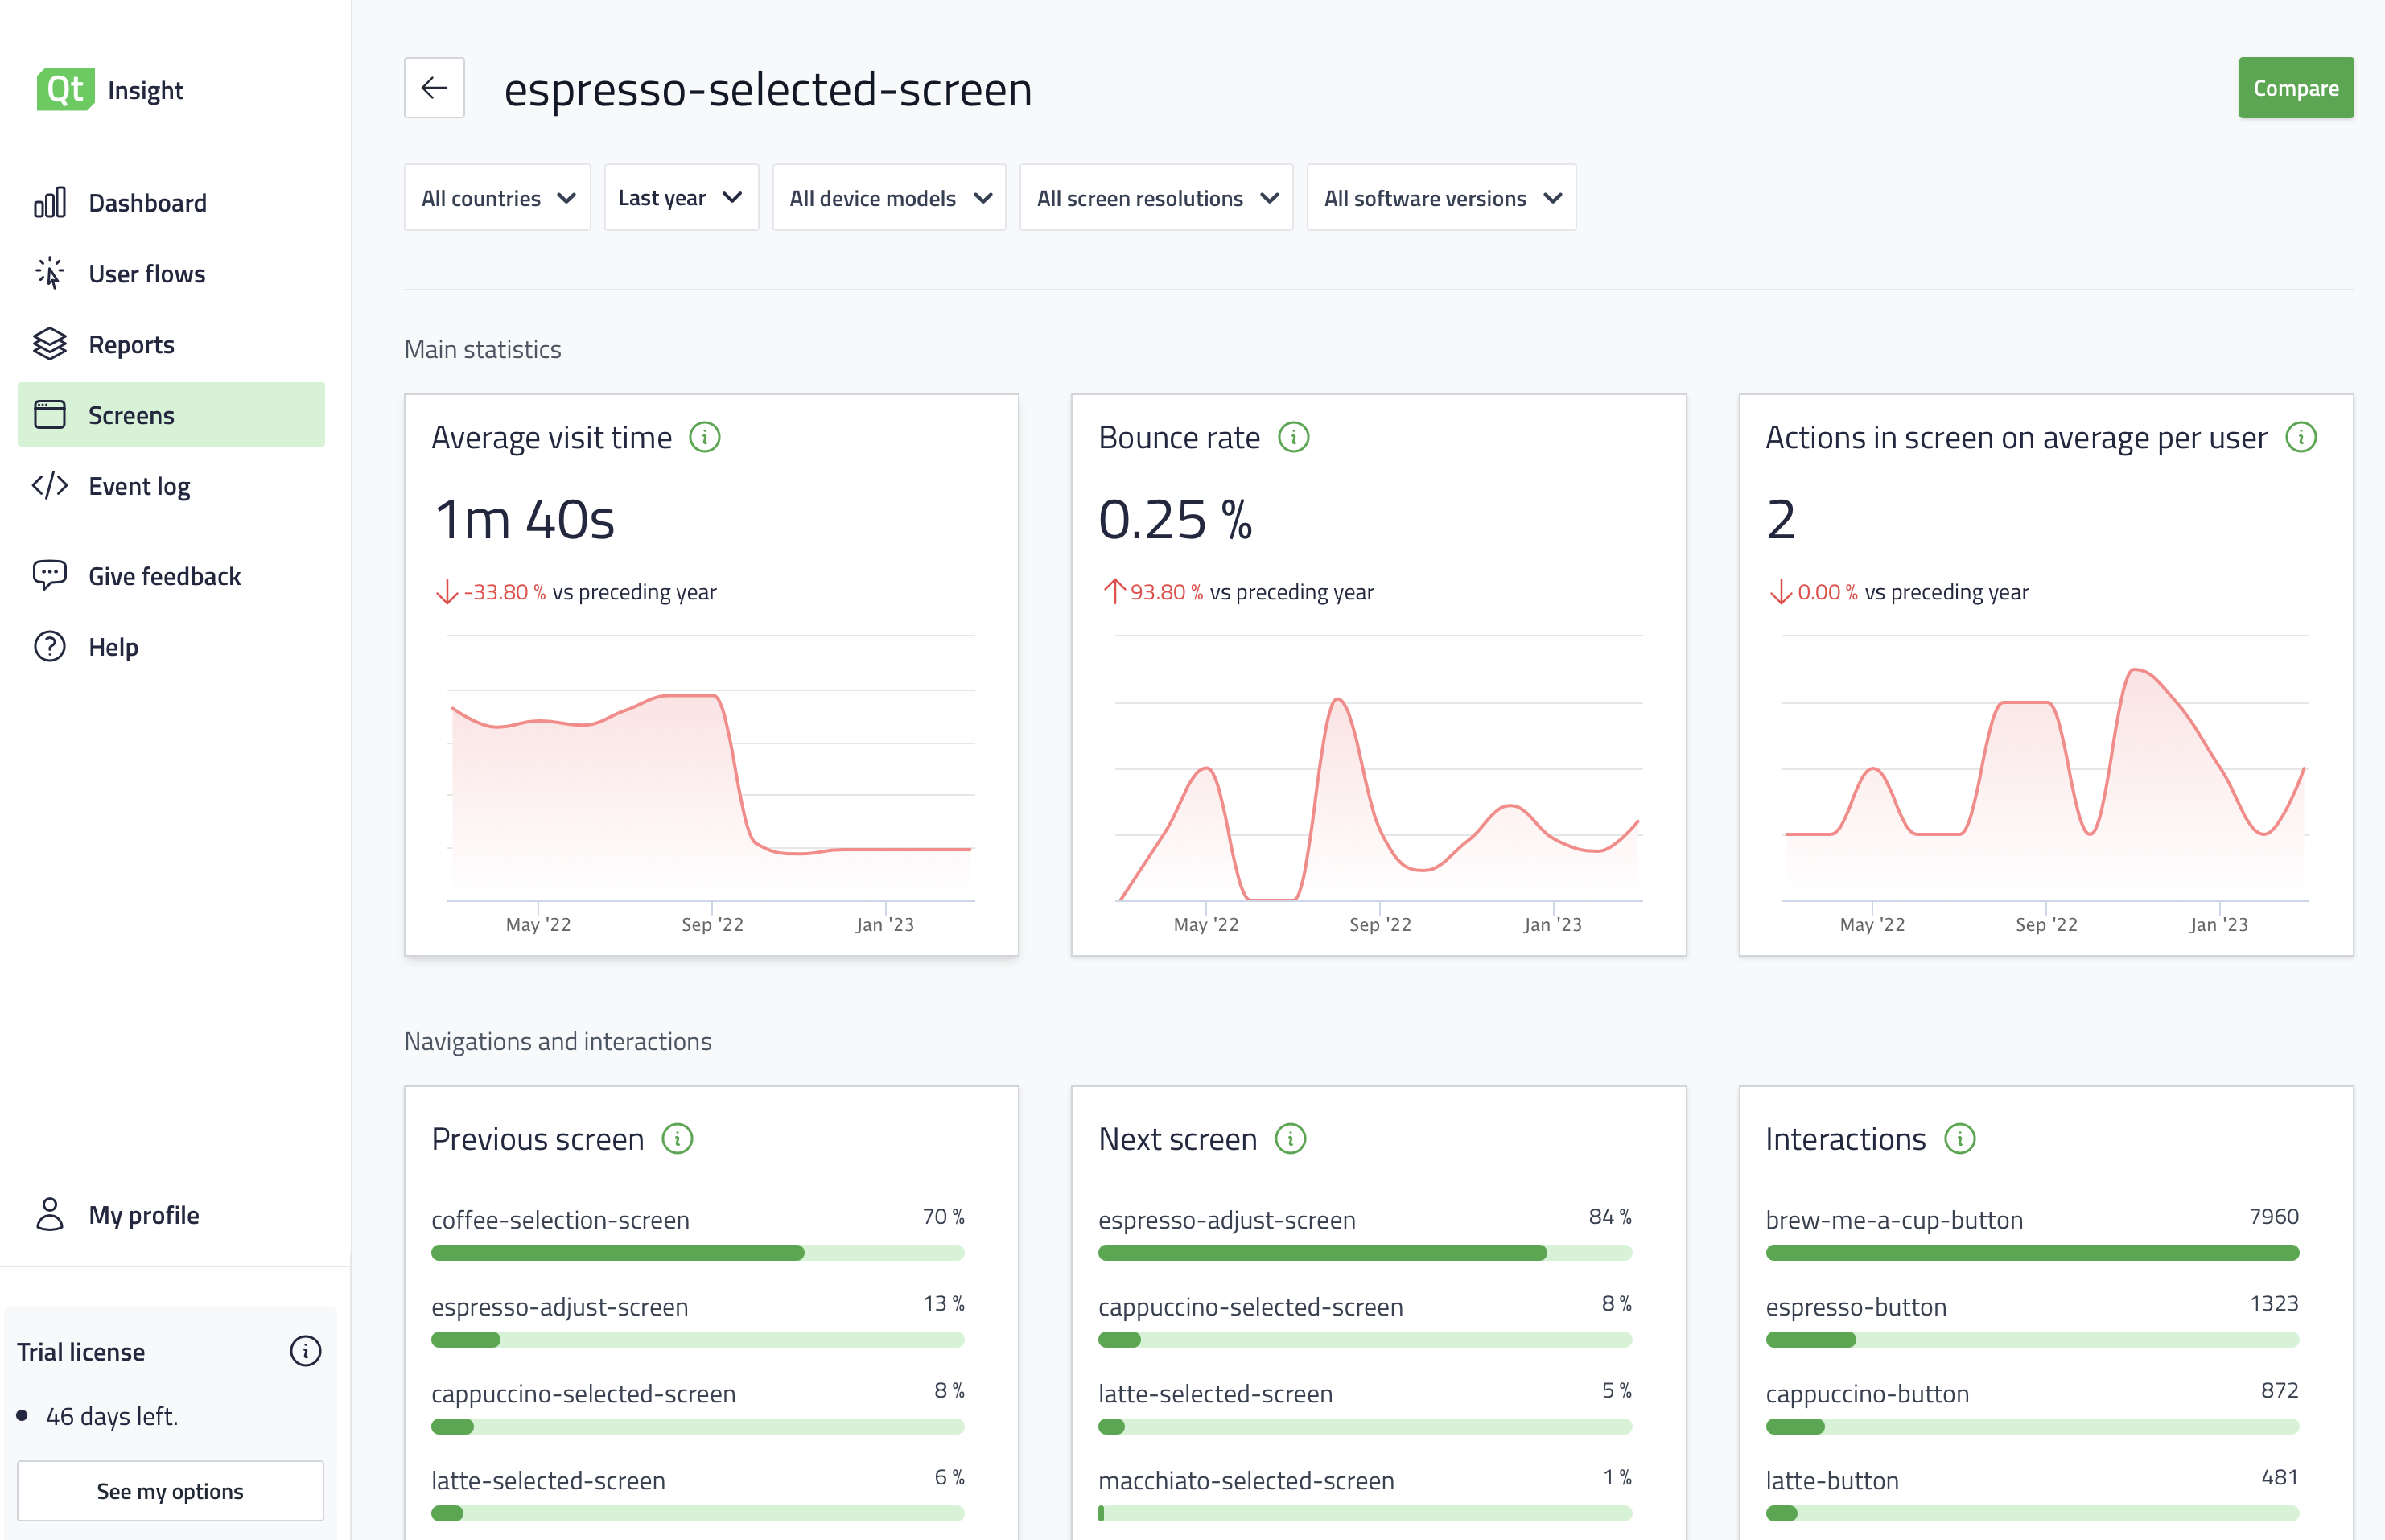
The Screens view includes the following metrics for each UI screen:
- Average visit time
- Bounce rate
- Actions in screen on average per user
- Previous screen
- Next screen
- Number of click interactions per interaction
- Visits by the time of day
- Visits by country
Event Log
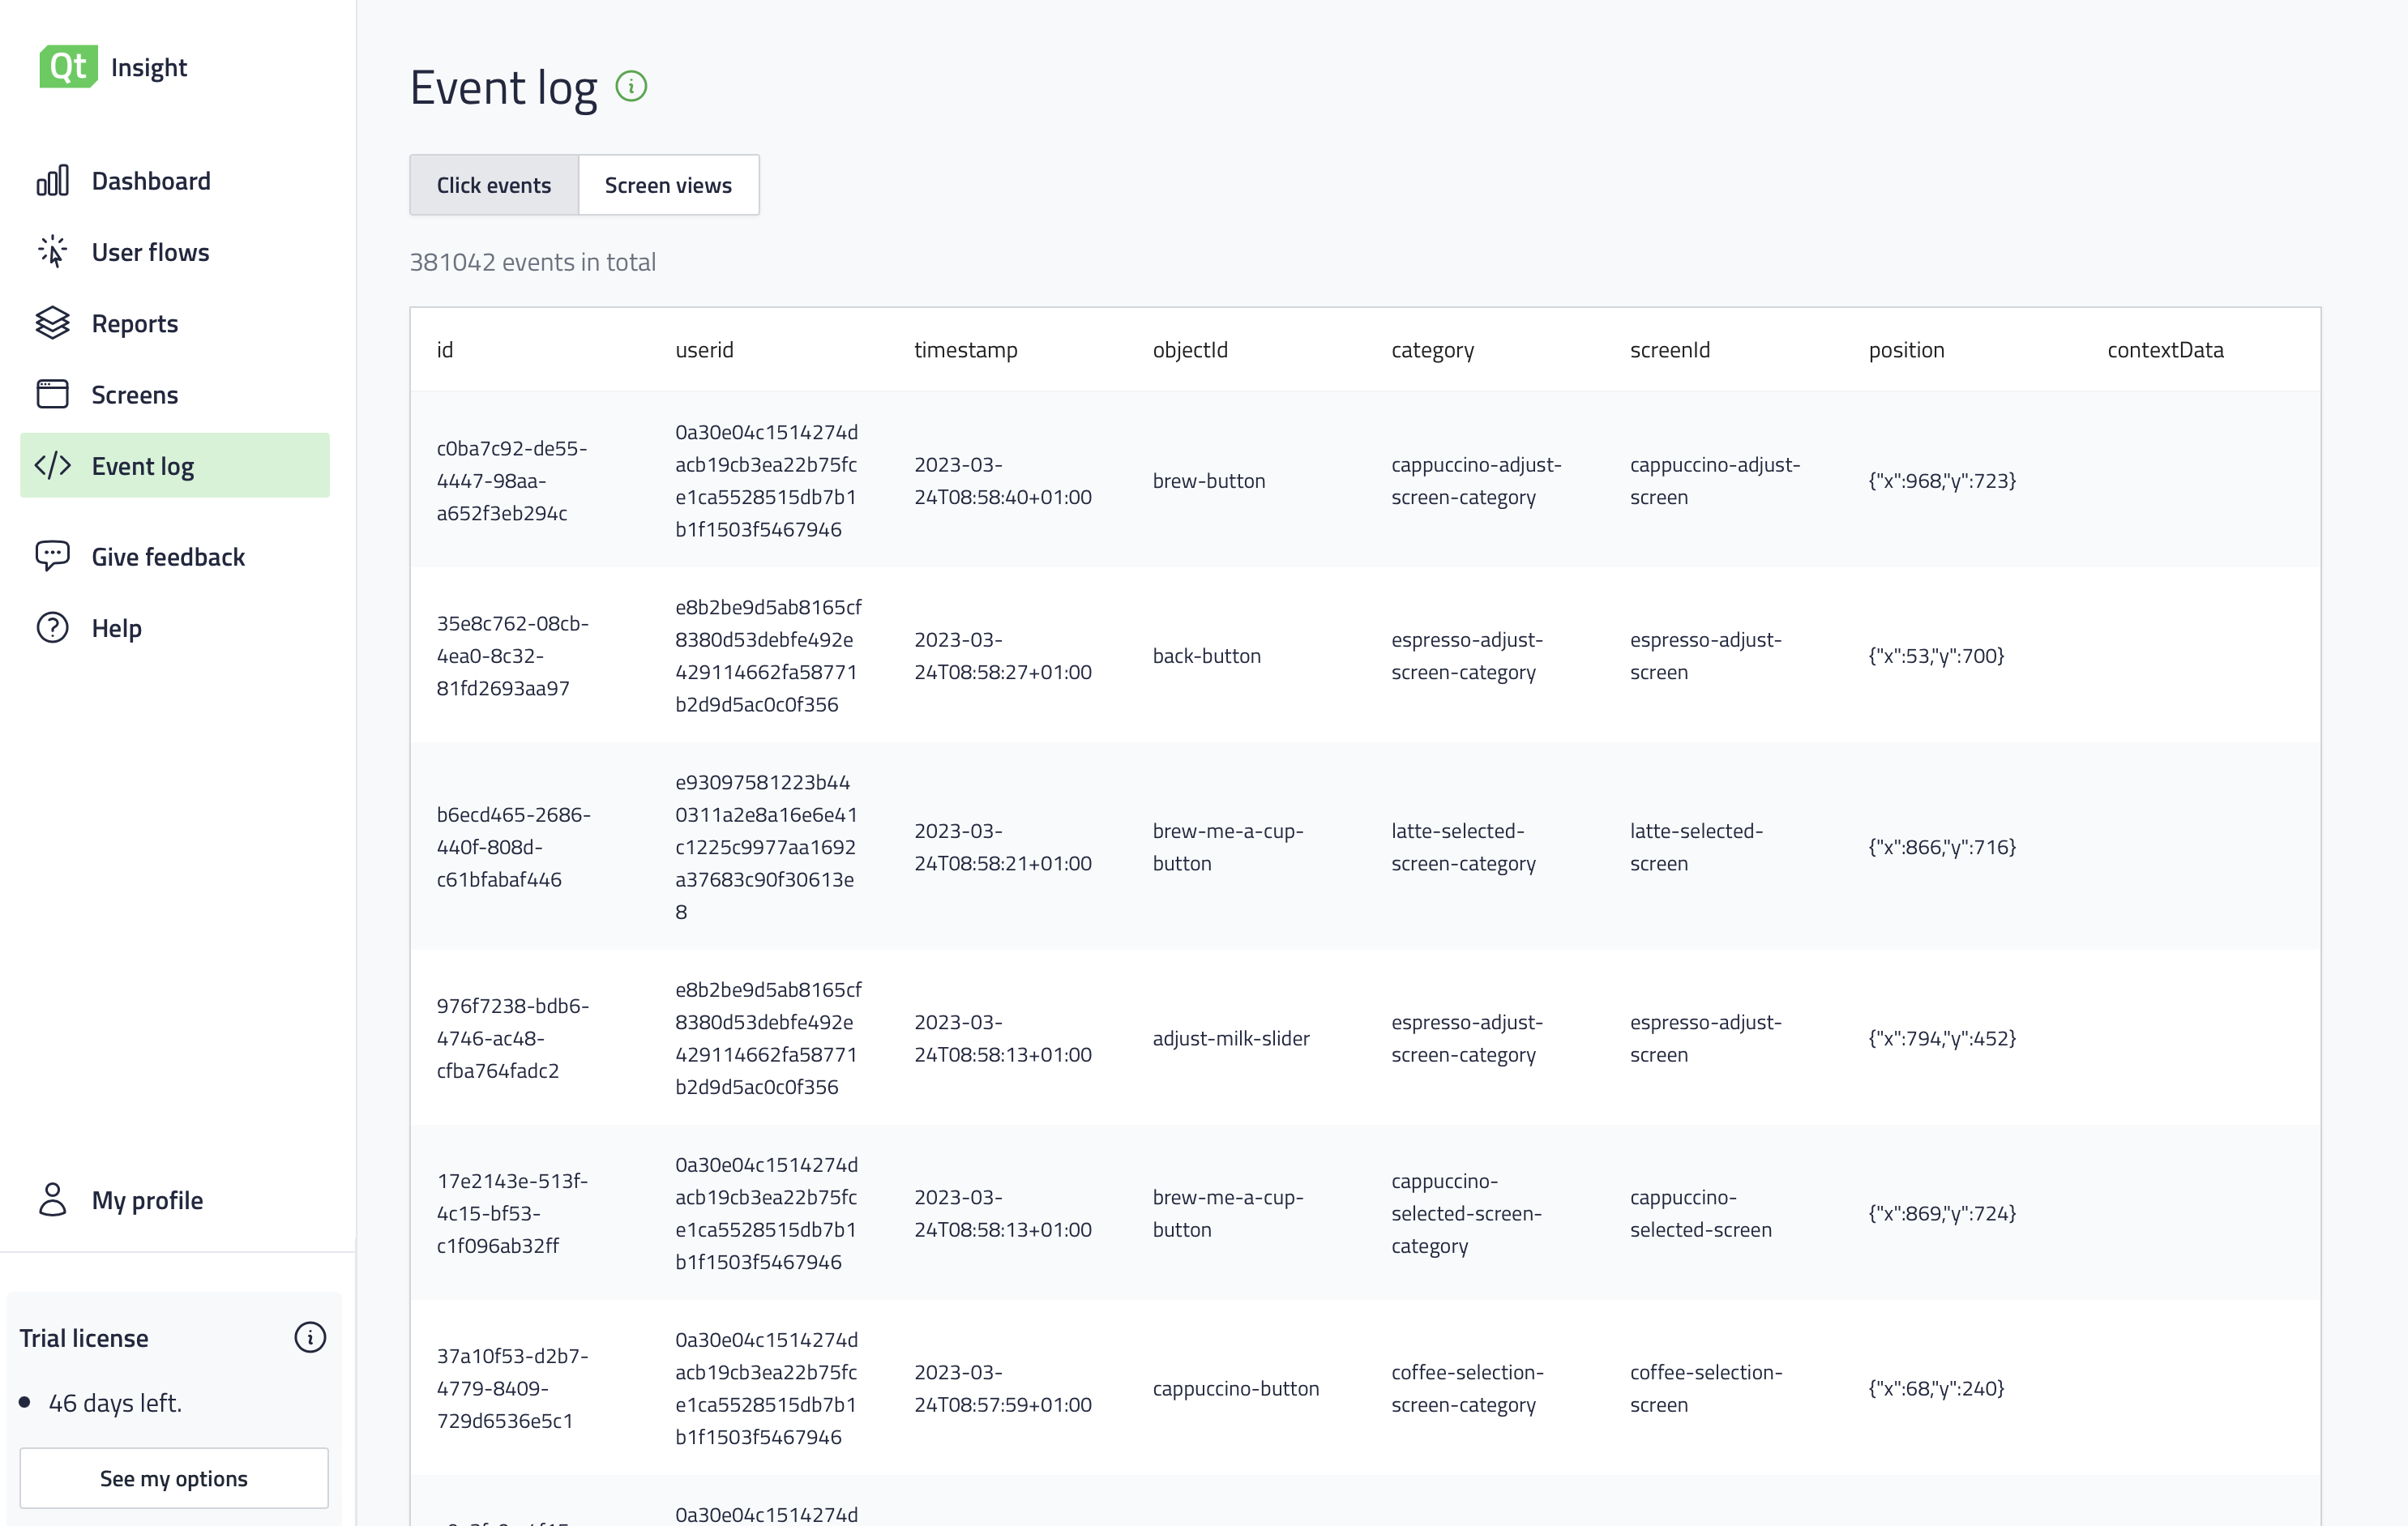
The Event Log view displays the event information in a table format. Events are the raw data an application sends to the Qt Insights Cloud. There are currently two kinds of events, "Click events" and "Screen views." Click events contains the object which was clicked, the part of the application where the object resides, and the position as X-Y coordinates. Screen view events track navigations between screens.
My Profile Page
The My Profile view allows the editing of the user's own profile data related to the use of Qt Insight. Leaving a Qt Insight organization is possible from this view.
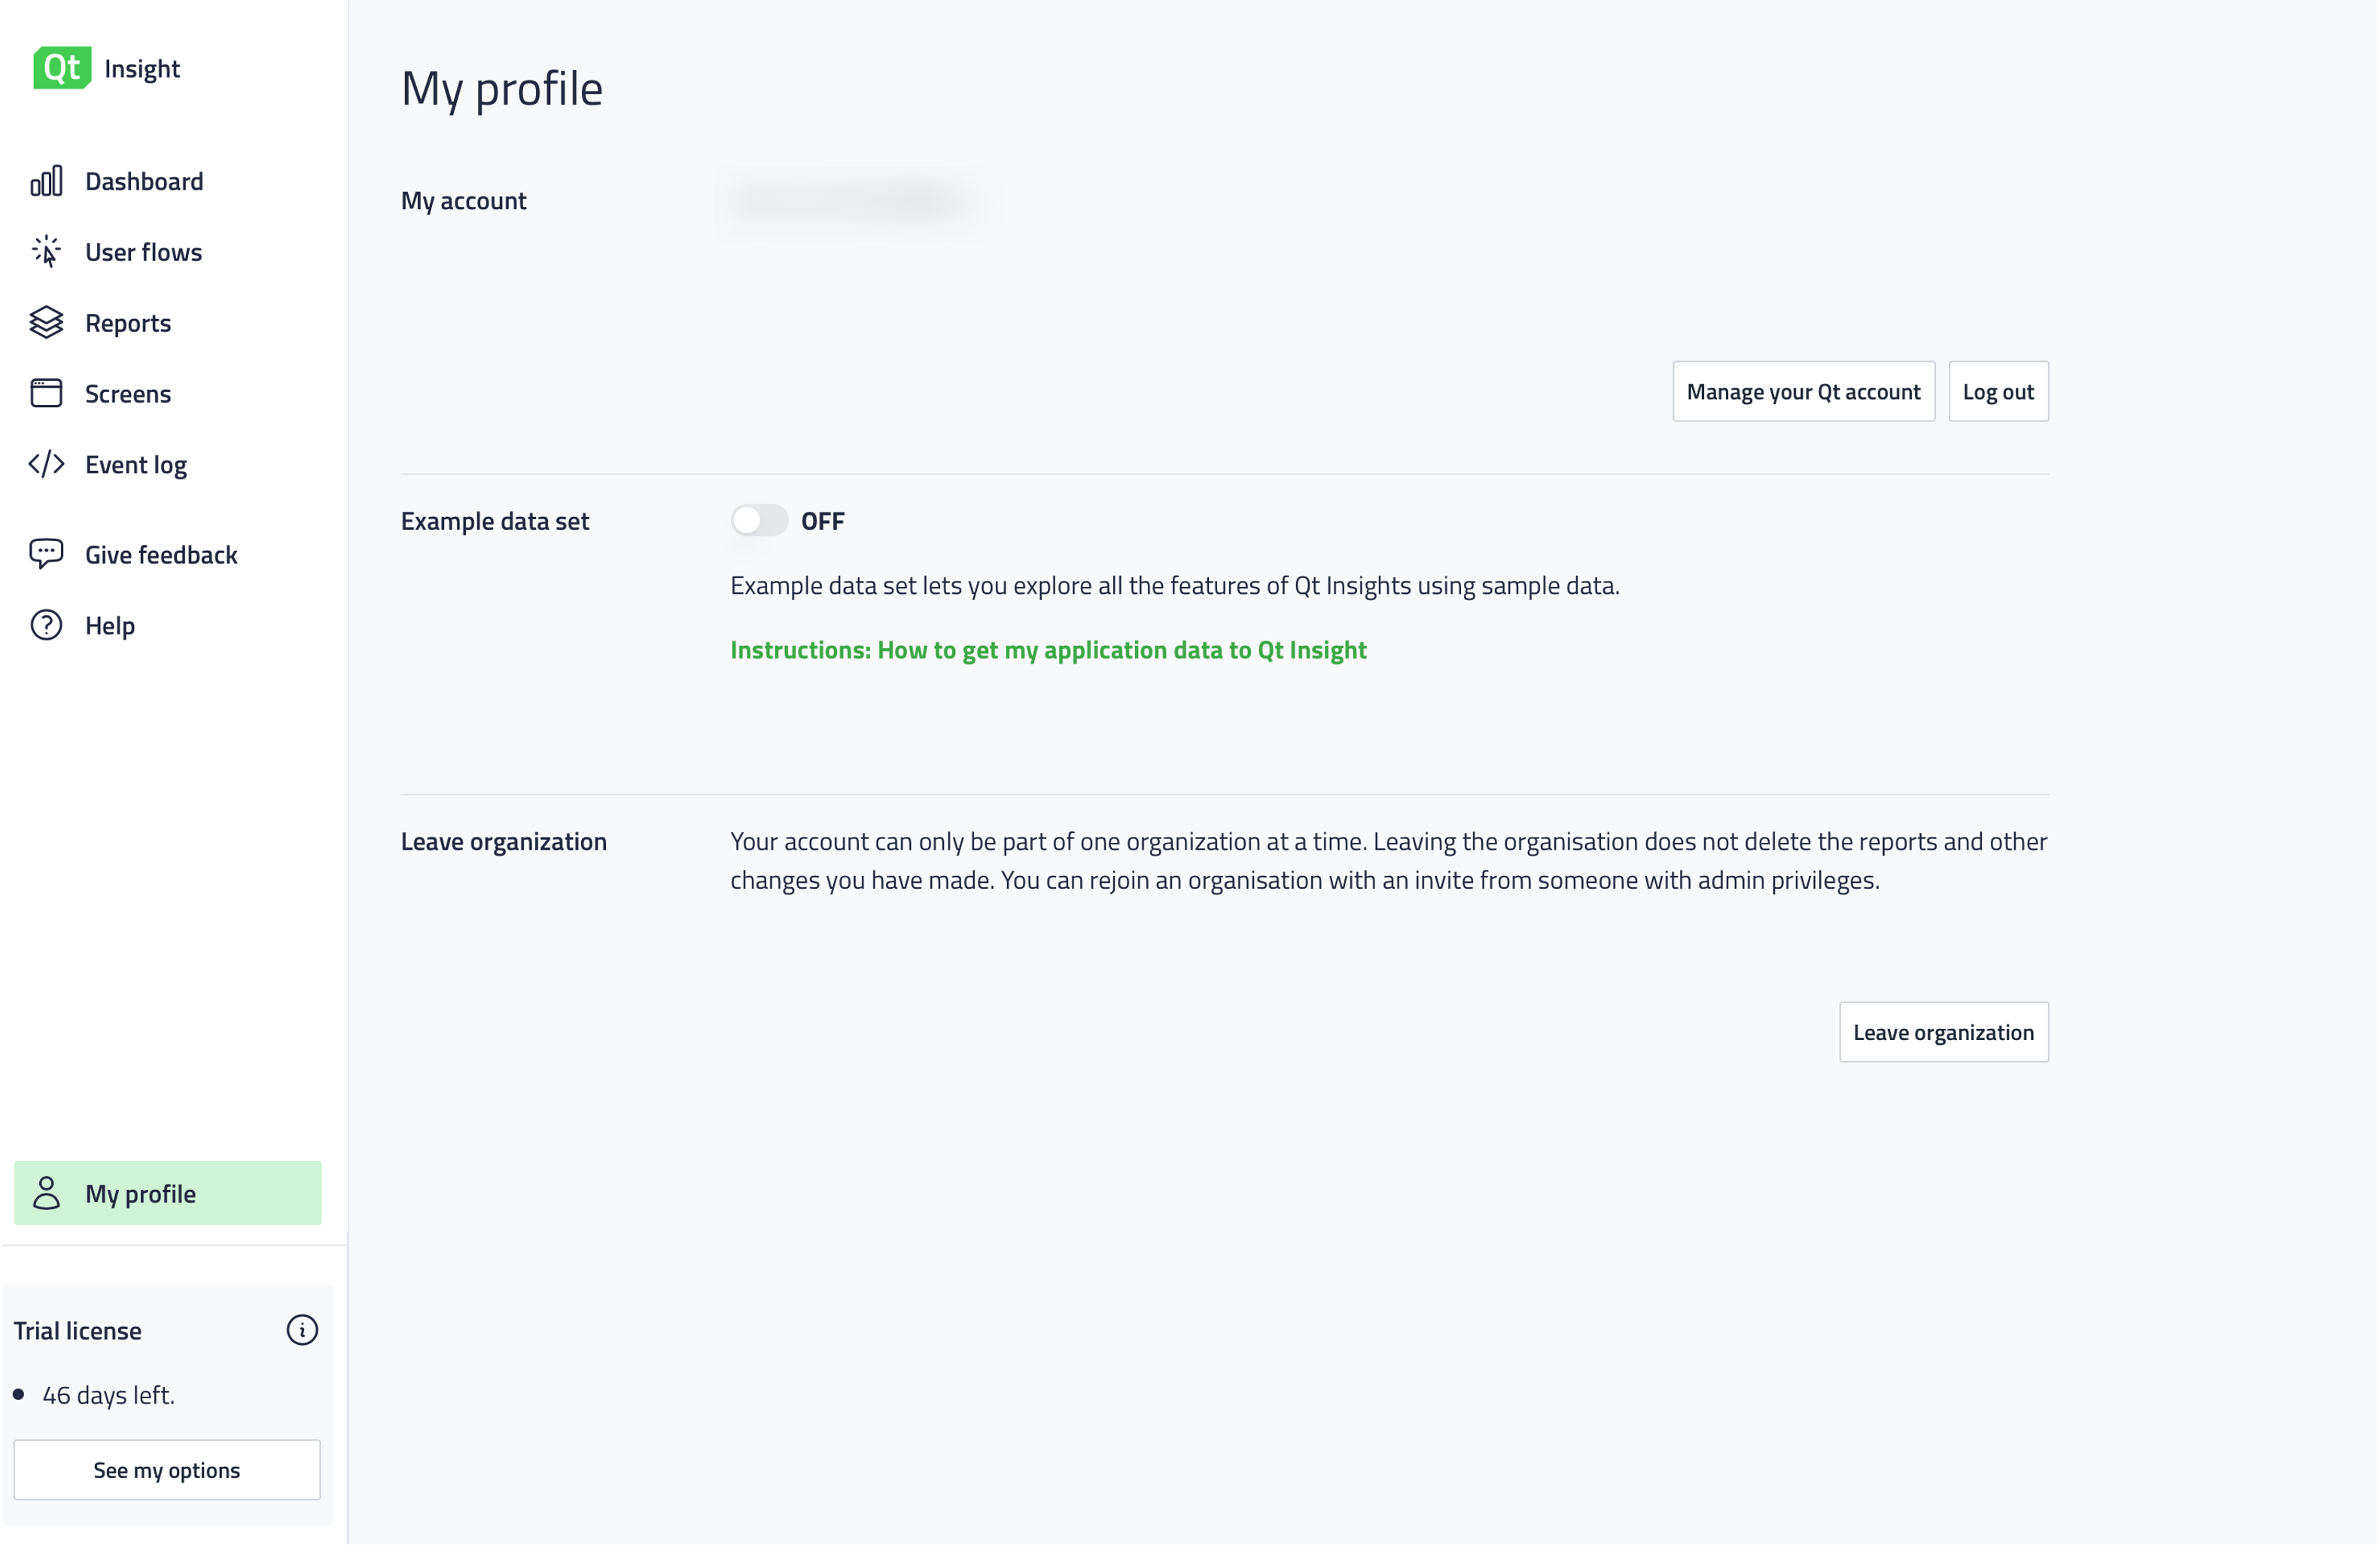
Users with admin privileges (typically the first user creating the Qt Insight organization) can manage the organization, such as the name. Administrators can edit the organization's team members or add new ones via an invite link or manually using a free-text form.
Qt Insight Cloud
The Qt Insight Cloud is serving as a back-end server for the solution. The Qt Insight Cloud runs on one of the world’s leading public cloud solutions in highly secure data centers.
Alternatively, the Qt Insight Cloud can be hosted in an on-premises solution or private cloud deployment of the user. This option is currently under development and shall be available at a later point in time.
The Qt Insight Cloud consists of a few components, each with a specific purpose:
- The Collector is a scalable cloud component that takes events from the Qt Insight Trackers and streams them forward.
- The Enrich component is a stream processor that handles raw data from the Collector, flattens it, enriches it with the available metadata, and streams them forward.
- The Storage component is a stream processor that stores the enriched event data for analysis to cloud storage.
- The Analysis component computes the raw data into separate analytics tables for the different metrics.
Qt Insight Tracker
The Qt Insight Tracker collects the events in the Qt software application, which runs on either a connected embedded device or a computer, potentially later on mobile devices. The Qt Insight Tracker is the software component that needs to be embedded into the target Qt application or the Qt UI component of the application. Qt Insight Tracker provides C++ and QML (Qt Modelling Language) APIs to track application usage and send the analytic data to the Qt Insight Cloud.
Event Tracking
The Qt Insight Tracker software can track click or screen events. Click events or UI interactions, such as pressing a button on a touch screen or moving a slider with a mouse. A screen event is the visit of the end user on a particular screen in the User Interface of the corresponding device.
Event Caching
The Qt Insight Tracker software component can cache analytics data temporarily on the target device. Developers can define the time interval in which the analytics data is sent to the Qt Insight Cloud. Sending data in batches can also be configured to optimise the data transmission reducing overhead.
Event Filtering
Qt allows users to collect all interaction data of predefined categories or custom categories. This makes it easy to automatically track interactive components like buttons so that there's no need to enable tracking for each of the buttons separately. Users cannot modify predefined categories but can enable and disable them.
What’s Next?
The Qt Insight solution is developed in an agile fashion and will see many enhancements in the coming months. Stay tuned!
Do make sure you’ll try it out yourself because you need nothing else than a Qt Account and at least a commercial evaluation license. If you have another Qt commercial or an open source license, then you can try it out immediately. We’ll provide demo data for you allowing a first impression on the Qt Insight Console even before setting up the Qt Insight Tracker on your application or device. Simply go to https://insight.qt.io/app and create your own Qt Insight cloud environment for a free 60 days evaluation.
For more information on how to get the overall solution working, please do check out our Getting Started information here.
If you want to know more about Product Analytics and how to benefit as a user do make sure you download the free eBook “Product Manager’s Guide to Analytics” from our web page. No registration required!
Blog Topics:
Comments
Subscribe to our newsletter
Subscribe Newsletter
Try Qt 6.8 Now!
Download the latest release here: www.qt.io/download.
Qt 6.8 release focuses on technology trends like spatial computing & XR, complex data visualization in 2D & 3D, and ARM-based development for desktop.
We're Hiring
Check out all our open positions here and follow us on Instagram to see what it's like to be #QtPeople.
.webp)


