QtGraphs: Qt's Newest Module for Visualizing Data in both 2D and 3D Graphs
September 23, 2024 by Sami Varanka | Comments
This blog post introduces Qt's newest module for visualizing data in both 2D and 3D graphs. Named QtGraphs, it will officially move out of tech preview with the release of Qt 6.8. This module integrates 2D and 3D data visualization into a single package, effectively replacing the older QtCharts and QtDataVisualization modules, which were introduced in the early Qt 5 era. By combining these modules, it becomes more intuitive and convenient for users to locate the appropriate module for all their data visualization requirements.
Improvements in rendering
When the 3D data visualization module was created, Qt didn't have the sophisticated graphics abstraction and 3D rendering engine it does today. Therefore, a custom-built OpenGL rendering engine was created solely for the QtDataVisualization. The rendering engine needed to work with devices using OpenGL ES 2 and thus lacked modern OpenGL features, such as instanced rendering. Moreover, since the rendering engine used OpenGL, Ui components were also required to use OpenGL. Forcing applications to use OpenGL led to suboptimal performance on platforms having better graphics alternatives, such as Direct3D on Windows. QtGraphs' 3D side is not restricted to just OpenGL since it uses Quick3D to visualize the graphs. QtCharts was highly coupled with the Widget framework as it used the graphics view framework. This usually meant using a software rendering solution. However, as QtGraphs works on the Quick framework, the 2D graphs use hardware-accelerated rendering.
Changes to 3D data APIs
The changes between QtDataVisualization and QtGraphs are not only under the hood since major rework has been done on data APIs. Old APIs required heap allocation of new data arrays. Now, however, all data can be allocated in the stack, and move semantics are utilized to avoid unnecessarily copying data. In addition to these API changes, the usage of proxies has now been clarified. In QtDataVisualization, the proxies contained the data supplied to the series. However, a proxy should not hold data but act as an intermediate layer for passing data. In QtGraphs, the data is still passed to proxies, but they give it to the series immediately rather than store it.
Widget support
QtGraphs can still be used with widgets like QtDataVisualization. However, there are some differences. As Quick3D uses Quick rendering infrastructure, QQuickWidgets should be used instead of plain QWidgets. While QtGraphs was in TP, every graph inherited from QQuickWidget. However, that design was suboptimal since it created a hard dependency on the widget framework. Therefore, the design was changed to use composition rather than inheritance.
Interaction
QtGraphs retains the same interaction methods for 3D graphs as QtDataVisualization, but their implementation has been greatly simplified. Previously, QtDataVisualization used QAbstract3DInputHandler, QInput3DHandler, and QTouch3DInputHandler. Now, there is a single class, QGraphsInputHandler, that consolidates all quick input handlers. While QtCharts translated events from QuickItem to graphics scene events, the 2D side in QtGraphs can now directly use events from QQuickItem.
Changes to theming
Previously, a theme had too much power over the visual aspects of the application, such as colors, visibilities, lighting, and font. For example, by setting a theme with light colors, all of the graph's colors could be changed to light colors, even if the platform uses a dark scheme. In QtGraphs, the Q3DTheme type has been replaced by QGraphsTheme and it is used by both 2D and 3D. The QGraphsTheme has been separated into two distinct logical parts: color scheme and theme.
Color scheme controls colors outside the main graph object, such as background, plot area, grid line, label background, and text. The color scheme has three values: light, dark, and automatic. An automatic color scheme follows the platform's color scheme. Our UX team has modernized color schemes and all the preset themes to follow today's standards used in Qt.
New features
With QtGraphs3D being implemented with QQuick3D which enables some new features.
We are now able to integrate other QQuick3D elements into graphs. Using the importScene property we are able to add any collection of models, lights, particle emitters, and reflection probes into the graphs scene. Similarly, we are also able to extend the scene environment for using e.g. tone mapping modes, post processing effects, or skyboxes. This can allow for some interesting scenes.
QtGraphs now also supports transparency for Bars3D and Scatter3D. Transparency for Surface3D is currently not being supported due to a known issue but will be added later.

3D Graphs Performance
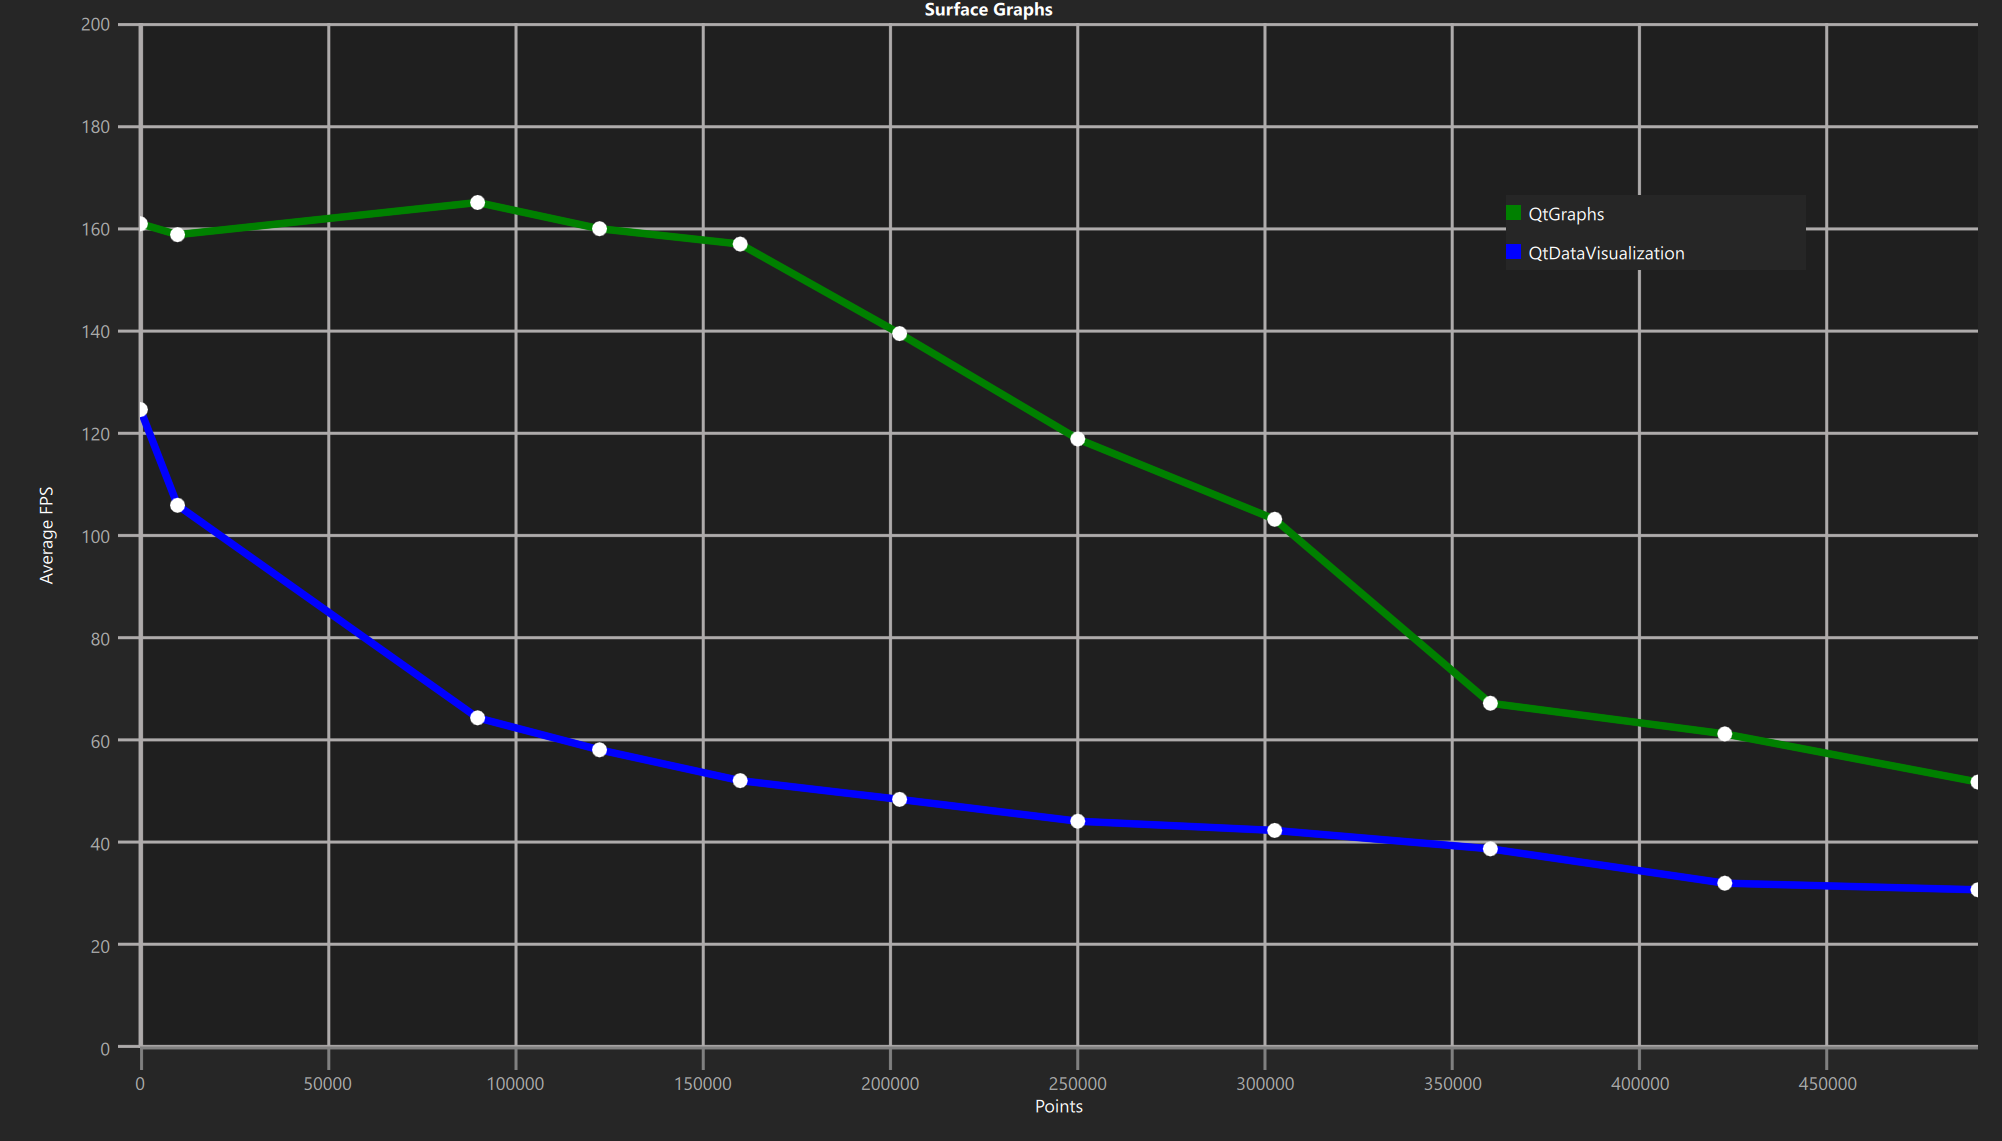
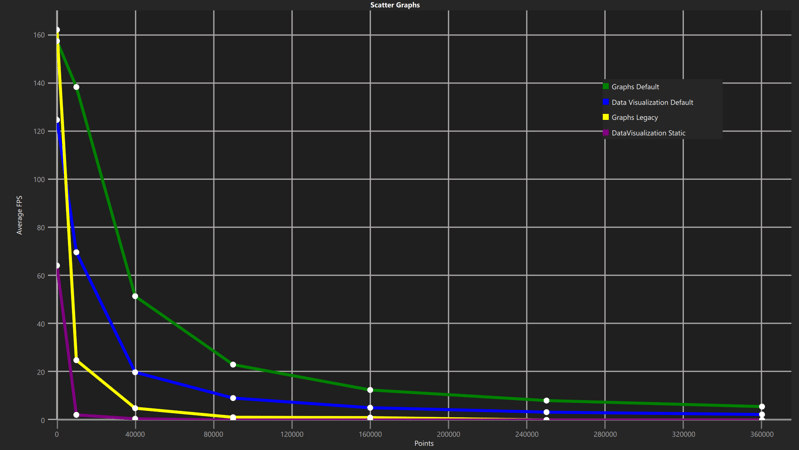
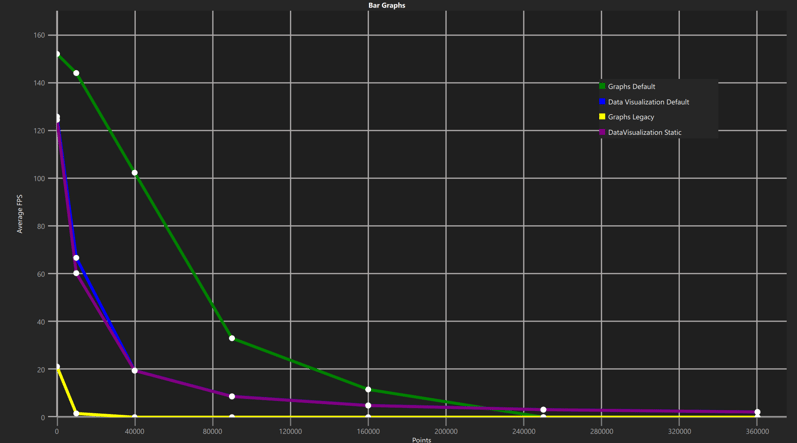
With QtGraphs, there has been a concerted effort to enhance the performance of all 3D graph types. For bar and scatter graphs, we can now utilize the model instancing capabilities provided by QtQuick3D to efficiently display a large number of bars or points. QtGraphs still supports non-instanced rendering, which can be enabled using the optimizationHint:Legacy property. For surface graphs, we have shifted the task of vertex positioning to the vertex shader, harnessing the GPU's power for this operation.
To verify the improvements, we devised a performance test. The test instantiates a graph starting at 100 points and with continuously changing data. The FPS of the scene is measured for a fixed amount of time after which the measures are aggregated. The number of points in the graph is then incremented, and the graph FPS is remeasured. This procedure is run for each graph type.
Bar and Scatter graphs in QtGraphs were run both in instanced and non-instanced configurations while
while Static and Dynamic configurations were used in QtDataVizualization.
The test was run on a Linux machine with an Intel I7-8700 CPU and NVIDIA Quadro 4000 GPU.
OpenGL was used as the RHI backend for QtGraphs, and VSync was turned off for all tests.
MSAA was set to 4X, and Shadows were turned off for the tests.


While the Legacy configuration of 3D Graphs performs weaker than default Data Visualization, the average FPS for each graph is notably higher for the default configuration of 3D Graphs, suggesting that the new techniques are effective in increasing performance.
Future development
QtGraphs will continue development with new requested features already being contemplated. For instance, while embedding 3D elements into graphs is possible, it is not yet possible to embed graphs into QQuick3D Scenes. Parametric spline rendering is another requested feature already in the works. For 2D, one upcoming feature is the possibility of changing whether the x-axis is displayed on the top or bottom side of the graph. In the same way, the y-axis can be changed from left to right.
Comments
Subscribe to our newsletter
Subscribe Newsletter
Try Qt 6.9 Now!
Download the latest release here: www.qt.io/download.
Qt 6.9 is now available, with new features and improvements for application developers and device creators.
We're Hiring
Check out all our open positions here and follow us on Instagram to see what it's like to be #QtPeople.
Commenting for this post has ended.
Will there be 3D line graphs in any subsequent release?
At least for the current Qt 6.7 I did not seem to find such graphs: https://doc.qt.io/qt-6/qtgraphs-overview-3d.html
The closest I could find are 3D Scatter Graphs. But those are "points" only. Use case: draw recorded flight paths (GPS paths with altitude data and timestamps (converted to Euklidean space)).
Hi. We're implementing spline series support for the next release (Qt 6.9), which could potentially be used for that purpose.
Oh, that's perfect! I thought that linear interpolation ("lines") would have been more straightforward (pun intended ;)), but I take spline interpolation any time, too! :)
(But perhaps you'll add an "interpolation option" later on anyway)
While I am very impressed with QtGraphs overall. I am a bit disappointed still with the 2D graph performance (and 3D as it should manage way more). I maintain an application which needs to render a scrolling lineplot which gets updated by realtime sensor values. We regularly want to have 100k datapoints in view and like to have over 120fps while doing so. And we are able to do so with this library https://github.com/pwuertz/QtQuickPlotScene . I did testing and it vastly outperforms QtGraphs 2D offering. Could you take a look to compare? QtGraphs seems to tank in performance with higher numbers due to CPU overhead, which is a shame
The 2D graphs in QtGraphs are mostly meant to be an easy-to-use and high-quality offering for doing 2D plots instead of a means to do custom plotting for a huge number of data points. That said, research has started for a 2D painter built on QRhi, meant to outperform the current offering and to be utilized in QtGraphs in a later release.
Sounds good, thanks!
Hi, How to watch the news about 2D painter build on QRhi? Is it on https://bugreports.qt.io/?
This research is still in its early stages but we will definitely inform once it becomes more concrete.
Do 2d graphs support model-view in 6.8?
Yes, there are modelmapper classes for 2D that take QAbstractItemModel, and display the data in the 2D graph.