The next release of the Qt Visual Studio Tools, v2.3.0, will allow debugging of QML applications in Visual Studio. It will be possible to set breakpoints in QML files and step through the execution of QML code. While in break mode, it will be possible to watch variables and change their values, as well as evaluate arbitrary expressions. The QML debug session will run concurrently to the C++ debug session, so it will be possible to set breakpoints and watch variables in both C++ and QML during the same debug run of the application.
This new debugging feature of the Qt VS Tools integrates with the QML debugging infrastructure, a part of the Qt QML module which provides services for debugging, inspecting, and profiling applications via a TCP port. To extend the Visual Studio debugger with features of the QML debugging infrastructure, a Visual Studio QML debug engine is provided. This debug engine consists, for the most part, of implementations of interfaces from the Active Debugging 7 (AD7) extensibility framework for the Visual Studio debugger.
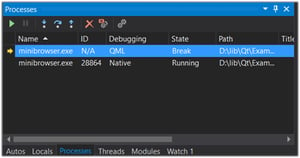
If a Qt project contains any QML resource files, starting a debug session (e.g. by pressing F5), besides launching the native application, now also connects to the QML debugging infrastructure of that application. This can be seen in the Processes window of the Visual Studio debugger: two processes are listed, a native process that corresponds to the actual physical process created for the C++ debugging session, and a QML process, which does not correspond to any physical process that is running on the machine, but rather represents the connection to the QML debugging runtime within the native process.
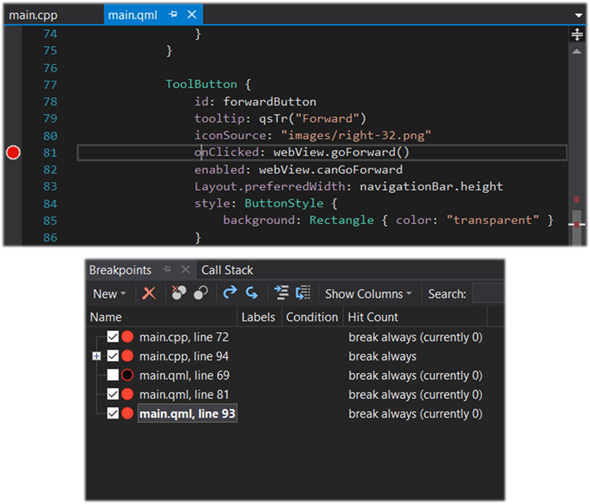
Since both a native process and a QML process are present, it is possible to request breakpoints both in C++ or QML code. The Visual Studio debugger will forward requests to the appropriate debug engine. As usual, a filled circular breakpoint marker in QML code indicates a valid breakpoint; this means that a breakpoint request for that file position has been sent to, and confirmed by the QML runtime.
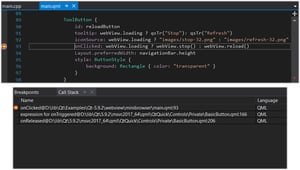
When a breakpoint is hit, Visual Studio will show the current state of the call stack. Unlike other scenarios of debugging applications that use different languages (e.g. .NET + Native debugging), the QML debug engine does not provide true mixed mode debugging. It runs concurrently with the native debug engine and, from the point of view of the Visual Studio debugger, it is not related to the native process. This means that, even though it is possible to debug both C++ and QML in the same debugging session, the stack that is shown when a QML breakpoint is hit will only include QML function calls -- the C++ context of those calls will not be available.
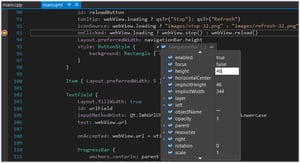
As in the case of native debugging, while in break mode, it is possible to view and modify the values of local variables, in the context of the currently active call stack frame, as well as create watches for any variable or expression. The Immediate window is also available for evaluation of any expression in the context of the current stack frame.
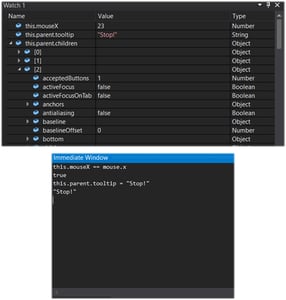
Moving the mouse over a QML expression pops up an instant watch window (or "DataTip"). The value of that expression in the current context is displayed and can also be modified.
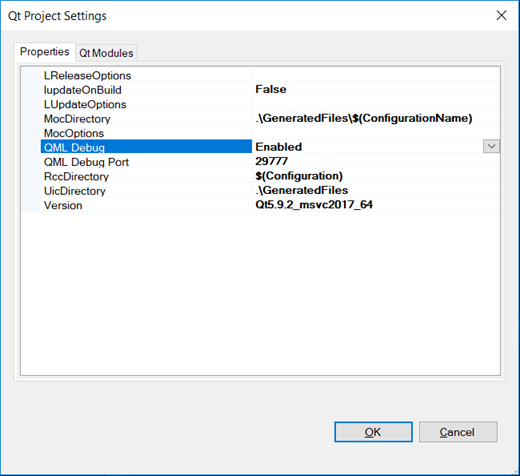
QML debugging is enabled by default for any Qt QML application. It is possible to disable QML debugging, and revert to native-only debugging, by opening the Qt project settings dialog and setting the "QML Debug" option to "Disable". In this dialog, it is also possible to change the port that is used by the QML debugging runtime.
As mentioned, the QML debugging feature of the Qt VS Tools will be available in the next version, scheduled for release in the Visual Studio Marketplace later this year. A preview version will shortly be available for download on the Qt website; we'll post a quick update here when it is available.


Commenting for this post has ended.
Sounds good! What about IntelliSense for QML Namespaces, Types/Properties (including those added from CPP code) and possible values (when they are enums)? Last time I checked this plugin QML support was as low as a simple syntax coloring.
IntelliSense for QML is something that we're definitely going to have in Visual Studio. However, it won't be ready in time for this next release. We'll post an update here as soon as we have more information.
What about Qt Quick Compiler ? Will the debugging work?
We're still looking into the best way to integrate the qtquickcompiler with the Qt VS Tools, so I don't yet have a definitive answer to that question. But it might be that the qtquickcompiler has to be disabled for the QML debugging to work. In that case, the add-in will automatically make the required modifications to the project properties in debug configurations.
This is great!
I wonder if there is a way to integrate it into my C#/QML integration?
https://github.com/qmlnet/q...
Thanks. In the current approach, the QML debug session is launched when the native-only debug engine starts a QML application. But it should be possible to get it to work also with the mixed mode debugger. That way, you could have a single debug session with the qmlnet code running in the mixed mode debug engine, and the QML debugging running in parallel, connected to the QML runtime in the qmlnet native plugin. You would have to send the required arguments to the QApplication and also compile with QTQMLDEBUG defined, as explained in http://doc.qt.io/qt-5/qtqui....
This is great, when is version 2.3 is going to be released?
We plan to release the official version to the Visual Studio Marketplace later this year. However, in a few days we should have a preview version available for download from the Qt website.
I am using visual studio 2019/Qt Visual Tools 2.4.3 and when I enable QML debugging in my application the debugger informs me that "The breakpoint will not currently be hit. No symbols have been loaded for the document".
Others having this issue might benefit from my answer on Qt Forum.
Hmmm, I have VS Qt Tools 2.6.0, but I don't have a QML Debug Port listed in my Qt project settings. Also, when I load a QML file, the application hangs with the message "QML Debugger: Connecting to socket {}..." What do I need to do in order to start the QML debugger?
Note: F5 doesn't start the QML debugger. What do I need to configure for that to happen?
This does not work with widget-based applications which only show a QML scene later on. If you launch a widget-based application without any QML scene, the QML debugging process terminates after 5 seconds or so, and any attempt to open a QML scene hangs the application (waiting for debugging process).
I reported this to support. Just wanted to let you know, in case you run into the same issue.
How to debug qml code in visual studio for projects created by cmake + qt? I searched for a long time but I didn't find any solution. Only projects created by qt visual studio tools through the wizard panel can be debugged, but nowadays most of the projects are created by cmake, how can I debug them? I see that cmake projects created by qt visual studio tools with cmake presets can be debugged, but I'm not sure how they are configured, and how to configure these presets correctly in cmake. For example, CMakePresets.json `{
“configurePresets": [ { “hidden": true, ‘name’: ‘Qt’. “name": ‘Qt’, “cacheVariables": { “CMAKEPREFIXPATH“:”$env{QTDIR}” }, “vendor": { “qt-project.org/Qt": { “checksum": ”wVa86FgEkvdCTVp1/nxvrkaemJc=” } } } ], { “vendor”: { “checksum”. “vendor": { “qt-project.org/Presets": { “checksum": ”67SmY24ZeVbebyKD0fGfIzb/bGI=” } } }
is this CMakeUserPresets.json{ “version": 3, “configurePresets": [ { “name": ‘Debug-x64’, “displayName": ‘Debug (x64)’,“cacheVariables": { “CMAKEBUILDTYPE": ‘Debug’, ‘CMAKEBUILDTYPE’: ‘Debug’, ‘CMAKECXX’: { “CMAKECXXFLAGS“:”-DQTQMLDEBUG” }, “CMAKECXXFLAGS”: “-DQTQMLDEBUG “environment": { “QMLDEBUGARGS“:”-qmljsdebugger=file:{778846d9-0524-4a42-ad37-8df7ea14d96c},block” }, “inherits": [ “Qt-Default” ] }, { “name": ‘Release-x64’, ‘displayName’: ‘Release (x64’, { “displayName“: ‘Release (x64)’, ‘binaryDir’:”${sourceDir}/out/build/release”, { “binaryDir": ‘${sourceDir}/out/build/release’, { “cacheVariables": { “CMAKEBUILDTYPE": ”Release” }, “cache”: { “CMAKEBUILD_TYPE”: “Release “inherits": [ “Qt-Default” ] }, { “hidden": true, ‘name’: ‘Qt-Default’, {
“inherits": ‘6.5.2msvc201964’, { ‘hidden’: true, ‘name’: ‘Qt-Default’, “vendor": { “qt-project.org/Default": { “checksum": ”6gVsp0NkL62j2aevfaEjiHalPU4=” } } }, { “hidden": true, { “name": ‘6.5.2msvc201964’,
“environment": { “QTDIR": ”C:/Qt/6.5.2/msvc2019_64” }, “architecture": { “strategy": ‘external’, ‘value’: ‘x64’, { “value": ”x64” },
“vendor": { “qt-project.org/Version": { “checksum": ”Fq+BEosqeS13PHx42JfpVljsWs4=” } } } ], { “vendor”: { “checksum”. “vendor": { “qt-project.org/Presets": { “checksum": ”5eZvWMuwL7+0areiAEUvEWpW5mc=” } } }` That's right, but it's not clear how “checksum”: “Fq+BEosqeS13PHx42JfpVljsWs4=” is generated. It looks like it's dynamic, so how do we generate cmake presets like this for our other cmake + qt projects? It looks like the ones generated by qt visual studio tools can actually be used to debug cmake + qt projects, but why is it so complicated? Nowadays, most c++ projects are built using cmake, and on Windows most of the development is done with visual studio as the main developer, and every time you debug qml code you have to switch to qtcreator. Every time I debug qml code, I have to switch to qtcreator, it's too much trouble.
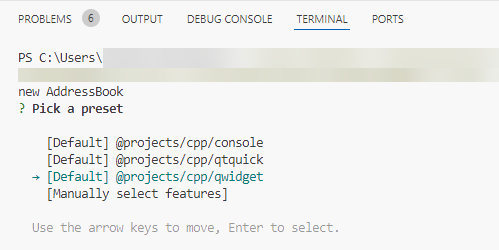
After much back and forth, I finally figured out how to debug QML code using the current QT Visual Studio tools with CMake + Qt + Visual Studio IDE. First, if you have a project built with CMake + Qt, open the root directory of your project using the "Open Folder" method in Visual Studio 2022, and select the CMakeLists.txt file. At this point, Visual Studio 2022 IDE will create CMakePresets.json and CMakeUserPresets.json for you based on the QT Visual Studio tools.
At this stage, you can only modify CMakeUserPresets.json to configure the dependencies required for building your project, ensuring that your project can be successfully built. Once the build is successful, you can directly press F5 to start debugging.
I hope the method I discovered can help those who have this need.....