How to shoot yourself in the foot using only a scene graph (neat optimization trick inside)
January 19, 2017 by Eskil Abrahamsen Blomfeldt | Comments
I am trying to get into the habit of blogging more often, also about topics that may not warrant a white paper worth of text, but that may be interesting to some of you. For those of you who don't know me, I am the maintainer of the text and font code in Qt, and recently I came across a curious customer case where the optimization mechanisms in the Qt Quick scene graph ended up doing more harm than good. I thought I would share the case with you, along with the work-around I ended up giving to the customer.
Consider an application of considerable complexity: Lots of dials and lists and buttons and functionality crammed into a single screen. On this screen there are obviously also labels. Thousands of static labels, just to describe what all the complex dials and buttons do. All the labels share the same font and style.
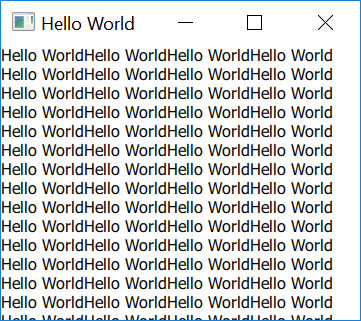
Narrowing the example down to just the labels, here is an illustration:
import QtQuick 2.5
import QtQuick.Window 2.2
Window {
    id: window
    visible: true
    title: qsTr("Hello World")
    visibility: Window.Maximized
    Flow {
        anchors.fill: parent
        Repeater {
            model: 1000
            Text {
                text: "Hello World"
            }
        }
    }
}
Now, the way the scene graph was designed, it will make an effort to bundle together as much of a single primitive as possible, in order to minimize the number of draw calls and state changes needed to render a scene (batching). Next, it will try to keep as much as possible of the data in graphics memory between frames to avoid unnecessary uploads (retention). So if you have a set of text labels that never change and are always visible, using the same font, essentially Qt will merge them into a single list of vertices, upload this to the GPU in one go and retain the data in graphics memory for the duration of the application.
We can see this in action by setting the environment variable QSG_RENDERER_DEBUG=render before running the application above. In the first frame, all the data will be uploaded, but if we cause the scene graph to re-render (for instance by changing the window size), we see output like this:
Renderer::render() QSGAbstractRenderer(0x2a392d67640) "rebuild: none"
Rendering:
 -> Opaque: 0 nodes in 0 batches...
 -> Alpha: 1000 nodes in 1 batches...
 - 0x2a39351fcb0 [retained] [noclip] [ alpha] [  merged]  Nodes: 1000  Vertices: 40000  Indices: 60000  root: 0x0 opacity: 1
 -> times: build: 0, prepare(opaque/alpha): 0/0, sorting: 0, upload(opaque/alpha): 0/0, render: 0
From this we can read the following: The application has one batch of alpha-blended material, containing 1000 nodes. The full 40000 vertices are retained in graphics memory between the frames, so we can repaint everything without uploading the data again.
So far so good.
But then this happens: Someone adds another label to our UI, somewhere in the depths of this complex graph of buttons, dials and labels. This label is not static, however, but shows a millisecond counter which is updated for every single frame.
While the scene graph does the correct and performant thing for most common use cases, the introduction of this single counter item in our scene breaks the preconditions. Since the counter label will be batched together with the static text, we will invalidate all the geometry in the graph every time it is changed.
To see what I mean, lets change our example and run it again.
import QtQuick 2.5
import QtQuick.Window 2.2
Window {
    id: window
    visible: true
    title: qsTr("Hello World")
    visibility: Window.Maximized
    property int number: 0
    Flow {
        anchors.fill: parent
        Repeater {
            model: 1000
            Text {
                text: index === 500 ? number : "Hello World"
            }
        }
    }
    NumberAnimation on number {
        duration: 200
        from: 0
        to: 9
        loops: Animation.Infinite
    }
}
The example looks the same, except that the 501st Text item is now a counter, looping from 0 to 9 continuously. For every render pass, we now get output like this:
Renderer::render() QSGAbstractRenderer(0x1e671914460) "rebuild: full"
Rendering:
 -> Opaque: 0 nodes in 0 batches...
 -> Alpha: 1000 nodes in 1 batches...
 - 0x1e672111f60 [  upload] [noclip] [ alpha] [  merged]  Nodes: 1000  Vertices: 39964  Indices: 59946  root: 0x0 opacity: 1
 -> times: build: 0, prepare(opaque/alpha): 0/0, sorting: 0, upload(opaque/alpha): 0/1, render: 0
As we can see, we still have a single batch with 1000 nodes, but the data is not retained, causing us to upload almost 40000 vertices per frame. In a more complex application, this may also invalidate other parts of the graph. We could even end up redoing everything for every frame if we are especially unlucky.
So, presented with this case and after analyzing what was actually going on, my first goal was to find a work-around for the customer. I needed to come up with a way to separate out the counter label into its own batch, without changing how anything looked on screen. There may be more ways of doing this, but what I ended up suggesting to the customer was to set clip to true for all the counter labels. Giving the counters a clip node parent in the graph will force them out of the main batch, and the updates will thus be isolated to the clipped part of the scene graph.
import QtQuick 2.5
import QtQuick.Window 2.2
Window {
    id: window
    visible: true
    title: qsTr("Hello World")
    visibility: Window.Maximized
    property int number: 0
    Flow {
        anchors.fill: parent
        Repeater {
            model: 1000
            Text {
                text: index === 500 ? number : "Hello World"
                clip: index === 500
            }
        }
    }
    NumberAnimation on number {
        duration: 200
        from: 0
        to: 9
        loops: Animation.Infinite
    }
}
Still the same code, except that the clip property of the 501st Text item is now set to true. If we run this updated form of the application with the same debug output, we get the following:
Renderer::render() QSGAbstractRenderer(0x143890afa10) "rebuild: partial"
Rendering:
 -> Opaque: 0 nodes in 0 batches...
 -> Alpha: 1000 nodes in 3 batches...
 - 0x143898ee6d0 [retained] [noclip] [ alpha] [  merged]  Nodes:  500  Vertices: 20000  Indices: 30000  root: 0x0 opacity: 1
 - 0x143898ec7e0 [  upload] [  clip] [ alpha] [  merged]  Nodes:    1  Vertices:     4  Indices:     6  root: 0x14389a3a840 opacity: 1
 - 0x143898edb90 [retained] [noclip] [ alpha] [  merged]  Nodes:  499  Vertices: 19960  Indices: 29940  root: 0x0 opacity: 1
 -> times: build: 0, prepare(opaque/alpha): 0/0, sorting: 0, upload(opaque/alpha): 0/0, render: 0
As you can see from the output, the text is now divided into three batches instead of one. The first and last are retained between frames, causing the full upload for each frame to be an insignificant 4 vertices. Since the clip rect contains the bounding rect of the text, we will not actually clip away any pixels, so the application will still look the same as before.
So all is well that ends well: The customer was happy with the solution and their performance problems were fixed.
Also, I gained some ideas on how we can improve the Qt Quick API to make it easier for users to avoid these problems in the future. Since we want performance to be stable from the first frame, I don't think there is any way to get around the need for users to manually identify which parts of the graph should be isolated from the rest, but I would like to have a more obvious way of doing so than clipping. My current idea is to introduce a set of optimization flags to the Qt Quick Text element, one of which is Text.StaticText, sister to the QStaticText class we have for QPainter-based applications.
In the first iteration of this, the only effect of the flag will be to ensure that no label marked as StaticText will ever be batched together with non-static text. But down the road, maybe there are other optimizations we can do when we know a text label never (or rarely) changes. And this is just one of a few optimization APIs I want to add to Qt Quick Text in the near future, so stay tuned! :)
Blog Topics:
Comments
Subscribe to our newsletter
Subscribe Newsletter
Try Qt 6.9 Now!
Download the latest release here: www.qt.io/download.
Qt 6.9 is now available, with new features and improvements for application developers and device creators.
We're Hiring
Check out all our open positions here and follow us on Instagram to see what it's like to be #QtPeople.


developing applications with software ready will definitely make you develop applications much faster and in a much easier way, although I prefer to develop them with artificial technology like this one here https://www.dataart.com/services/ai-and-ml I feel that in addition to doing it automatically they do it in the most correct