Peek and Poke, Vol 4
October 15, 2010 by André | Comments
Qt Creator 2.1 is looming over the horizon, and therefore, the time has come to add another chapter to the Tale of Debugging.
To keep it short, I'll try to focus on two issues: architectural changes in the 2.1 cycle and some kind of update, long overdue, on extending the debugger to display your own data types.
Architectural Changes
There have been quite a few fundamental changes to Qt Creator's debugger plugin during the recent development cycle. They were mainly driven by the need to extend the debugger scope beyond the original C++ debugger front-end to allow mixed C++/JavaScript/QML debugging.
Incidentally, the results are beneficial also for the more traditional use cases. Previously, we could take static snapshots of a process and jump between them to compare variable contents, memory, and so on. However, the first such jump had to kill the live process, because most of the debugger plugin was a singleton (nobody wants to debug more than one process at a time, right? ;-}), and before switching the data models to one of the snapshots, the live process had to make way. Not anymore. We can now have as many engines running at the same time as we want, so the live process engine can just continue while examining a snapshot. Not to mention that switching between snapshots is faster now...
Talking about performance: While the CDB integration (that is used to access binaries compiled with the Microsoft compiler on Windows) is still far from snappy, startup times have been reduced by 15 seconds. Each, time, the, debugger, is, started. That makes it bearable at least.
In the Free gdb world (i.e. Linux, Symbian, Maemo, Windows/MinGW) we now can take advantage of gdb's shiny new "Dwarf Index" generation. This significantly reduces warm start times. For the Qt Creator project itself (which consists of more than a half a million lines in .cpp by now, not to mention headers or generated code, pulling in more than a hundred shared objects) I now get a warm start inside the debugger in 13 seconds (and a cold start in around 40). By leaving out non-vital plugins this can go down (depending on the definition of vital) to four(!) seconds. For smaller projects, such as the Qt examples, this is barely noticeable anymore. So you now really have no reason not to use Qt Creator's gdb integration out of fear of falling asleep while waiting for application startup.
And getting started with debugging is still as simple as it used to be: Load or create a project. Press F5.
That's it. No magic dancing needed on your side, not launch configuration to setup, no black roosters harmed in the process. For having a quick look at a core file or a running process, you can even skip the project bit and directly start Qt Creator with the -debug <name_of_core_file> or -debug <process_id_of_running_process> command line arguments.
And now for something completely different:
(Re-)Introduction to Data Dumpers for the Qt Creator gdb front-end
The topic has been covered in the first and second post, but by now, so many details have changed that following the process outlined there will not directly lead to success.
So let's start over.
The beast has appeared under different names in the past: Data Dumpers, Pretty Printers, Debugging Helpers. I guess none of them is really to-the-point anymore, but in my brain it's still "Data Dumpers". It's all about examining data structures at a higher level. No funny d-Pointers, vector data hidden behind void *, image data as hex string (or not visible at all), and so on. I really don't want to see any of that when debugging code using containers. Or a QObject. All I want to do then is to see the actual contents of the container or the properties of the QObject I am working with, and maybe have a way to navigate to the objects that are connected to it.
That need led to the original incarnation of the Dumpers, as introduced in the first blog. They worked, but a recurring request since then - starting with the comments to the blog post - was to make that easily extensible by users of Qt Creator.
By now, and a change of technology later, I think we are there. Gdb nowadays supports Python as a scripting language which is way more complete and especially faster than the old canned sequences of commands. It even has built-in pretty printing but, while this is nice and usable on the command line, it has some severe limitations that makes it unusable for our purpose. In a display hierarchy, it creates only one level at a time, which makes virtual data, such as the "signals" group subnode in a QObject, difficult to display, and the MI "var object" machinery impossible to use. Not to mention robustness issues in case of uninitialized objects which are rather common in C++. Luckily, all this does not matter: Having a proper scripting language is all that's needed.
So... how to get started?
Suppose we have the following code:
QUrl url(QString("http://www.nokia.com"));
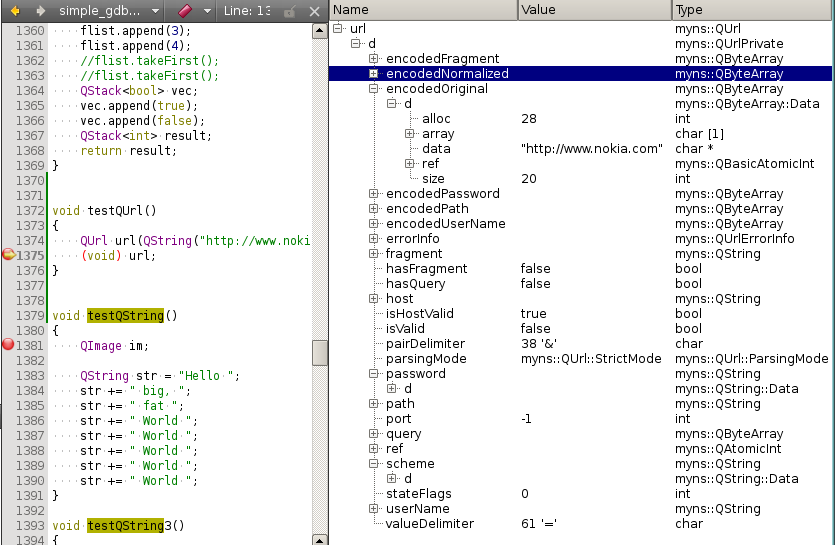
Traditionally, the debugger would show you a tree, as follows:
I think "Eeeks!" is about the most common reaction to such a display of "information".
How did I find out the data was visible in encodedOriginal?
By trial and error. And note that I was lucky that it was a QByteArray which happens to have a char * member for the data which happens to be handled natively by gdb. If it had been a QString, it would have been a ushort * and all I would have seen would have been the numerical value '104'.
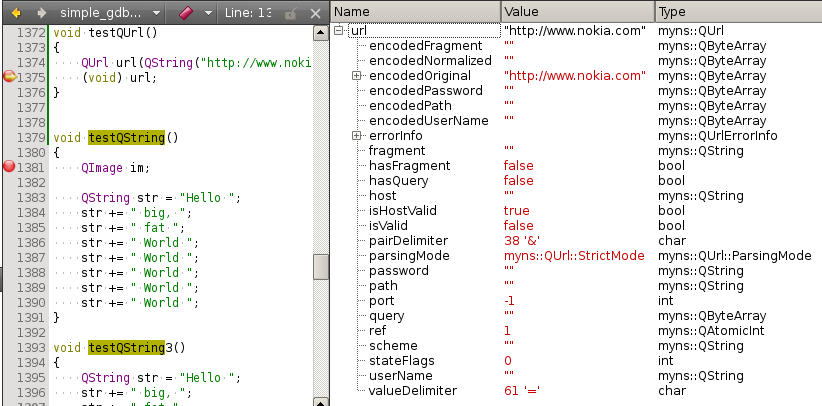
I'd pretty much prefer to see something like:
at the top-level, instead, with the option (but not the need) to look at the details -- even if they could look a bit nicer:
So what do I do? Knowing that Qt Creator will set up its Python-based data dumpers anyway, I just need to have: (a) a dumper for QUrl, and (b) inject it into the process.
(a) is easy: We need to define a python function qdump__QUrl which will be automatically called when an object of the type QUrl (or myns::QUrl when Qt was built in the namespace myns) is encountered:
def qdump__QUrl(d, item):

    d.putStringValue(item.value["d"].dereference()["encodedOriginal"])

    d.putNumChild(0)
The function basically writes a put QString item taken from url.d->encodedOriginal into the value column of the Locals&Watchers view and disallows further expansion.
If expansion is wanted, a full implementation of the dumper would look something like the following:
def qdump__QUrl(d, item):

    d.putStringValue(item.value["d"].dereference()["encodedOriginal"])

    d.putNumChild(1)    # Any non-0 value will do. A wart...

    if d.isExpanded(item):

        with Children(d):

            d.putFields(Item(data, item.iname))
(b) is easy, too: There is a Gdb Startup Script setting in the gdb options page. This points to a script that is parsed by gdb after the Python machinery is set up. Therefore, we can just write the function above into a mydumpers.py file and point the setting there. Unfortunately (or fortunately, as it speeds up things), the list of known dumpers is cached, so the cache needs to be flushed. There are several ways to do that. The simplest, but least obvious, is to add a line containing only bbsetup() at the end of mydumpers.py. (Smells like a bug, doesn't it? I guess I'd better fix that in 2.2...)
It is also possible to implement several ways to display data of a given type, and switch between them on-the-fly, globally or on a per-object base. Qt Creator uses that by itself to allow the selection of different encodings for string-like data, such as char * or wchar_t *, or to allow the viewing of data in separate windows.
I'll spare you the details for now and rather finish with the list of latest additions to the Dumper Zoo: New in 2.1 are QDate, QTime, QHostAddress, QRegion, boost::optional, QSharedData, QSharedDataPointer and QTextCursor. Some others like QObject, QList, C-style arrays, QSize, QSizeF, QImage/QPixmap, std::vector, QVariant(QString), qulonglong, std::size_t, std::ptrdiff_t, QScopedPointer, QStandardItem have seen some bug fixes or improvements. The most notable change here is that QObject now displays dynamic user defined properties.
Blog Topics:
Comments
Subscribe to our newsletter
Subscribe Newsletter
Try Qt 6.10 Now!
Download the latest release here: www.qt.io/download.
Qt 6.10 is now available, with new features and improvements for application developers and device creators.
We're Hiring
Check out all our open positions here and follow us on Instagram to see what it's like to be #QtPeople.


